Highlights
- Cytos Protein Kits use cyclic immunofluorescence chemistry to detect up to 20 protein targets, including both custom and fixed panel content, at single-cell resolution alongside morphology from the same sample
- Optionally pair the protein cartridge with a second cartridge to add same-cell 3′ transcriptome and/or guide RNA sequencing measurements
- All 20 targets in the Cytos protein panels show subcellular localization and expression patterns consistent with published literature
Introduction
The Cytos multiomics workflow on the AVITI24 system captures morphology, protein expression, 3’ transcriptome, and guide RNA sequencing from the same sample in a single run. This technical note focuses on the Cytos protein workflow, which uses cyclic immunofluorescence (IF) to detect up to 20 protein targets in a multiplexed panel, one antibody pair at a time, and provides spatially resolved, intensity-based readouts for protein targets.
Here we summarize the Cytos Protein Cartridge workflow and probe chemistry underlying per-cycle protein detection, the performance of the platform’s 20 protein targets against expected biology and reference IF methods, and discuss overall detection performance and reproducibility.
Cytos Protein Workflow
The Cytos protein workflow is performed using the Cytos Protein Kit which includes the Cytos Protein Cartridge. The Cytos Protein Cartridge can be run as a standalone screening kit or in conjunction with RNA detection in a two-cartridge workflow in which the protein portion of the workflow is completed first.
The Cytos Protein Cartridge allows up to 20 protein targets using Cytos protein panels, biotinylated custom protein probes, or a combination of the two to support your experimental goals. The Cytos protein panels are available as 4-plex panels across five focus areas spanning organelle morphology, neuronal/glial morphology, cytoskeletal and nuclear structure, immune subtyping, and cell signaling. Custom protein probes are labeled with Cytos fluorescent reporters before addition to the protein cartridge. ABclonal provides an expanded catalog of clones and biotinylation services for custom protein probes.
Run times are dependent on protein plexity. A 4-plex protein panel takes approximately 9 hours while a 20-plex protein panel takes approximately 22 hours.
For the two-cartridge workflow, an application-specific RNA cartridge that enables RNA sequencing (Optical Pooled Screening, 3’ Transcriptome, or Multimodal Pooled Screening) is loaded after the protein workflow is complete. The system pauses the run to allow for review of key protein data (assessment of the per target intensities relative to positive and negative controls). If the protein data meets expectations, the second cartridge workflow is initiated. See the Cytos Protein User Guide for detailed instructions. After the two-cartridge Cytos run completes, visual and quantitative per-cell outputs from all modalities are combined in a single Spatial Data Object.
Protein Detection Chemistry
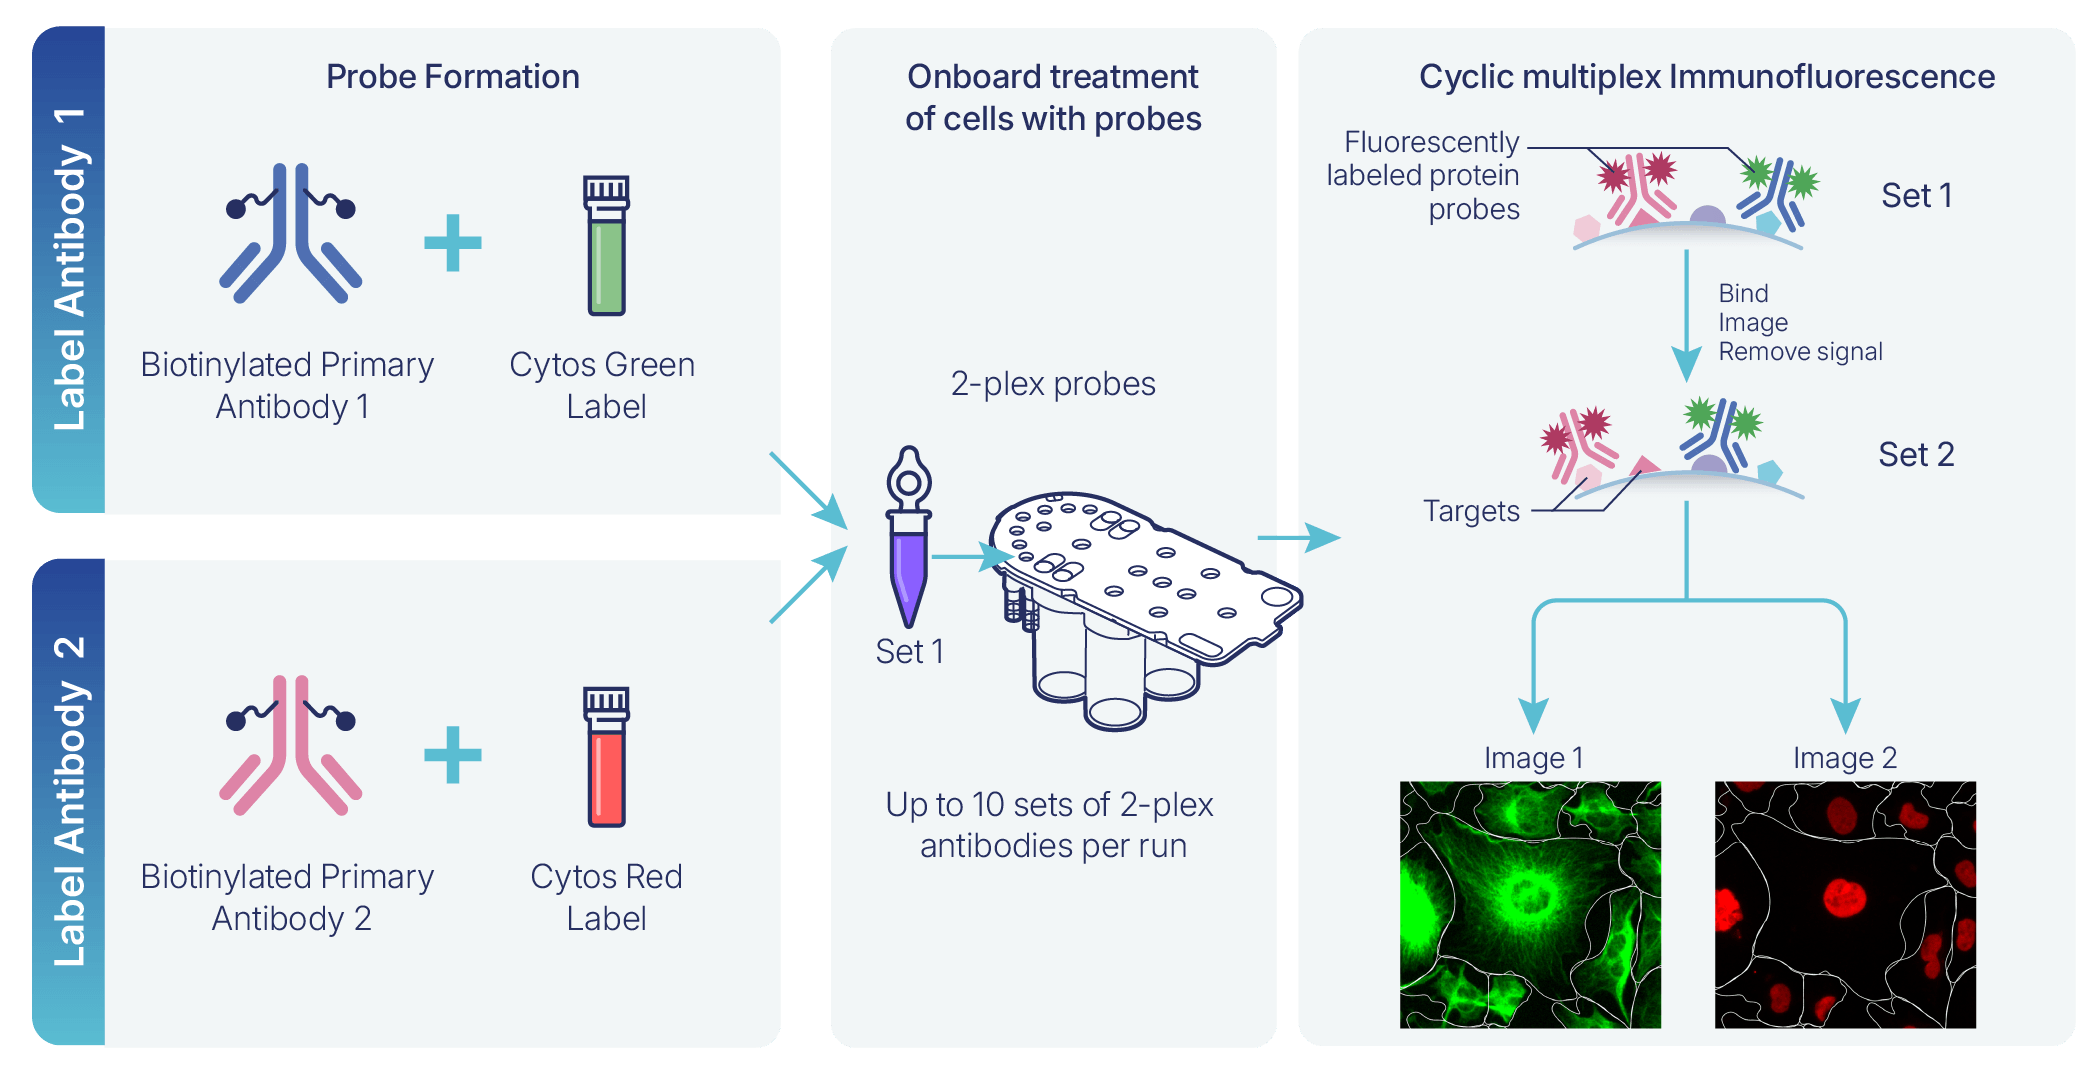
Figure 1. Probe preparation chemistry for antibody-based Cytos probes. Each probe consists of a biotinylated antibody bound to a fluorescent reporter. One red dye-labeled probe and one green dye-labeled probe are pooled together for simultaneous 2-plex detection. Note: Colors shown in tubes are for illustration only and do not represent actual reagent colors.
Figure 1 shows the probe preparation chemistry for Cytos probes. Each protein probe is built with a biotinylated primary antibody and a green or red fluorescent label at a controlled degree of labeling (DOL, the dye-to-antibody molar ratio). Red- and green-labeled probes for the two targets assigned to a given imaging cycle are pooled into a single 2-plex reagent. A similar chemistry is used with WGA (cell membrane) and TOMM20 (mitochondria), while Reddot2 (nucleus) and phalloidin (actin) are dye-based probes. WGA, TOMM20, phalloidin, and Reddot2 make up the standard onboard Cell Paint markers, which serves as input to cell segmentation and morphological analysis.
Each Cytos imaging cycle detects two protein targets simultaneously in the red and green channels. That cycle's fluorescent signal is removed, and the next 2-plex pair is applied and imaged. Repeating this cycle allows a single Cytos protein cartridge run to build up a multiplexed panel of up to 20 targets. Like other fluorescence-based methods, Cytos provides single-cell relative protein quantity, not total abundance data.
In addition to the 20 protein targets, the Cytos workflow includes two negative controls — mouse-derived (red channel) and rabbit-derived (green channel) isotypes — to establish nonspecific background. Background from these isotype controls is driven primarily by fluorescence channel (red or green) rather than antibody host species: the two controls produce similar intensity values regardless of host (mouse vs. rabbit) or cell line. As a result, Element recommends comparing each target to the negative control imaged in the same color channel, not the one matched by host species, although performance between the two is generally comparable. A large discrepancy between the two negatives may indicate sample-specific background (for example, species-specific Fc receptor binding) rather than true channel-driven background. Running custom negative probes alongside the isotype controls can help confirm whether the discrepancy is species-specific. TOMM20 (mitochondria) is also provided as part of every run with cell paint and serves as a positive control.
Concordance with Immunofluorescence Microscopy
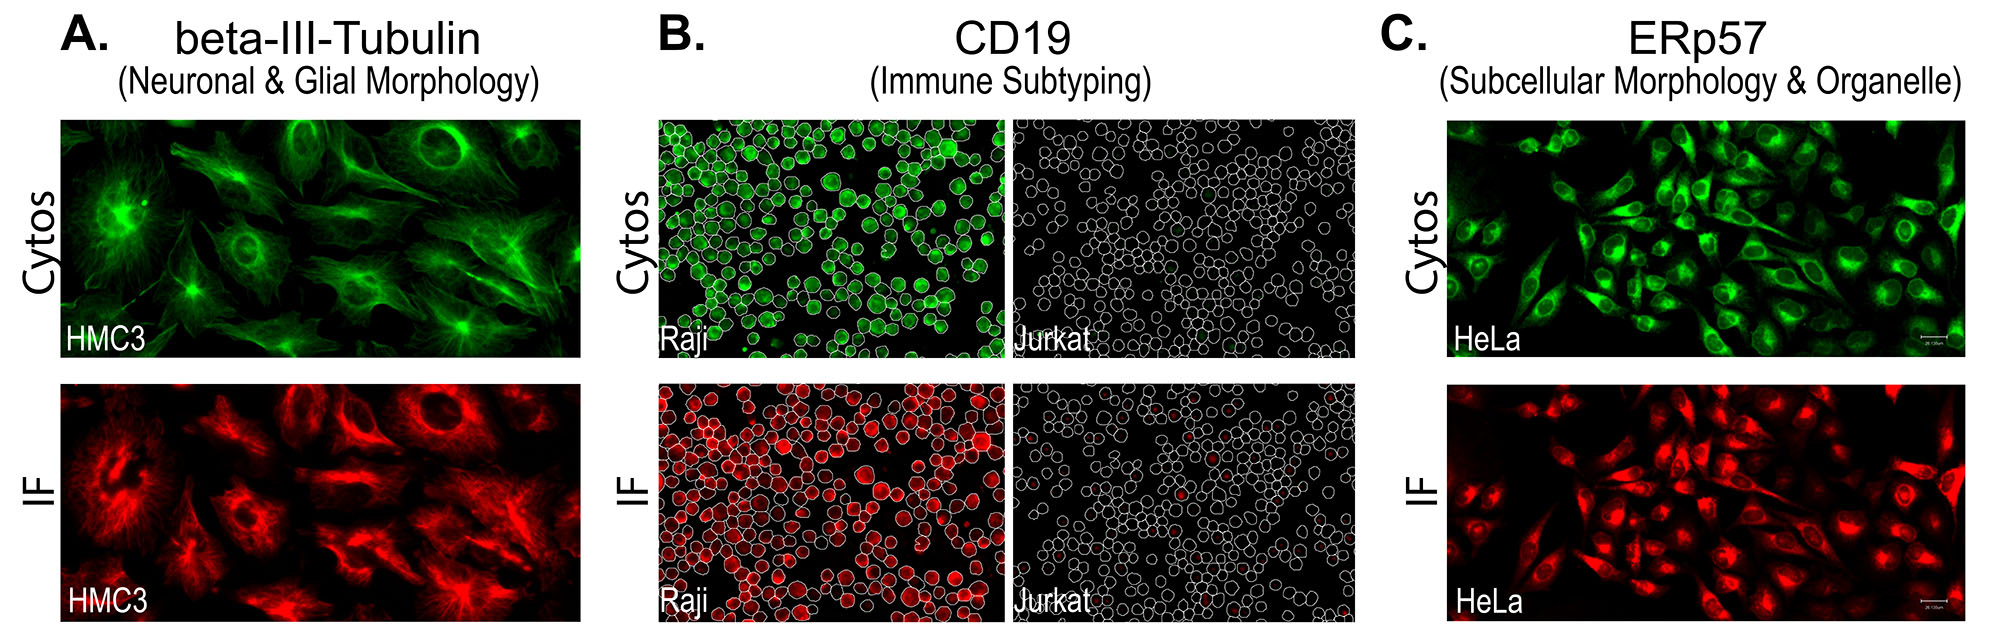
Figure 2. Images showing Cytos concordance with single-cycle reference IF across three different proteins in different cell types.
To confirm that Cytos detection reproduces the expression and morphology patterns seen with a conventional, single-cycle reference immunofluorescence method, matched samples were stained and imaged by both approaches and compared side-by-side across all five protein panels. Concordance was assessed qualitatively by matching cell morphology and staining pattern across the same cell populations. Figure 2 shows three examples of Cytos images alongside reference IF images for the same target. In each case, the expression observed with Cytos is in concordance with the reference IF method.
Specificity and Concordance with Literature
Targets in each panel were also evaluated for their specificity and concordance with their literature-reported localization patterns. Figure 3 provides example images for representative targets from each Cytos protein panel, demonstrating their specificity and concordance with expected patterns from the literature.
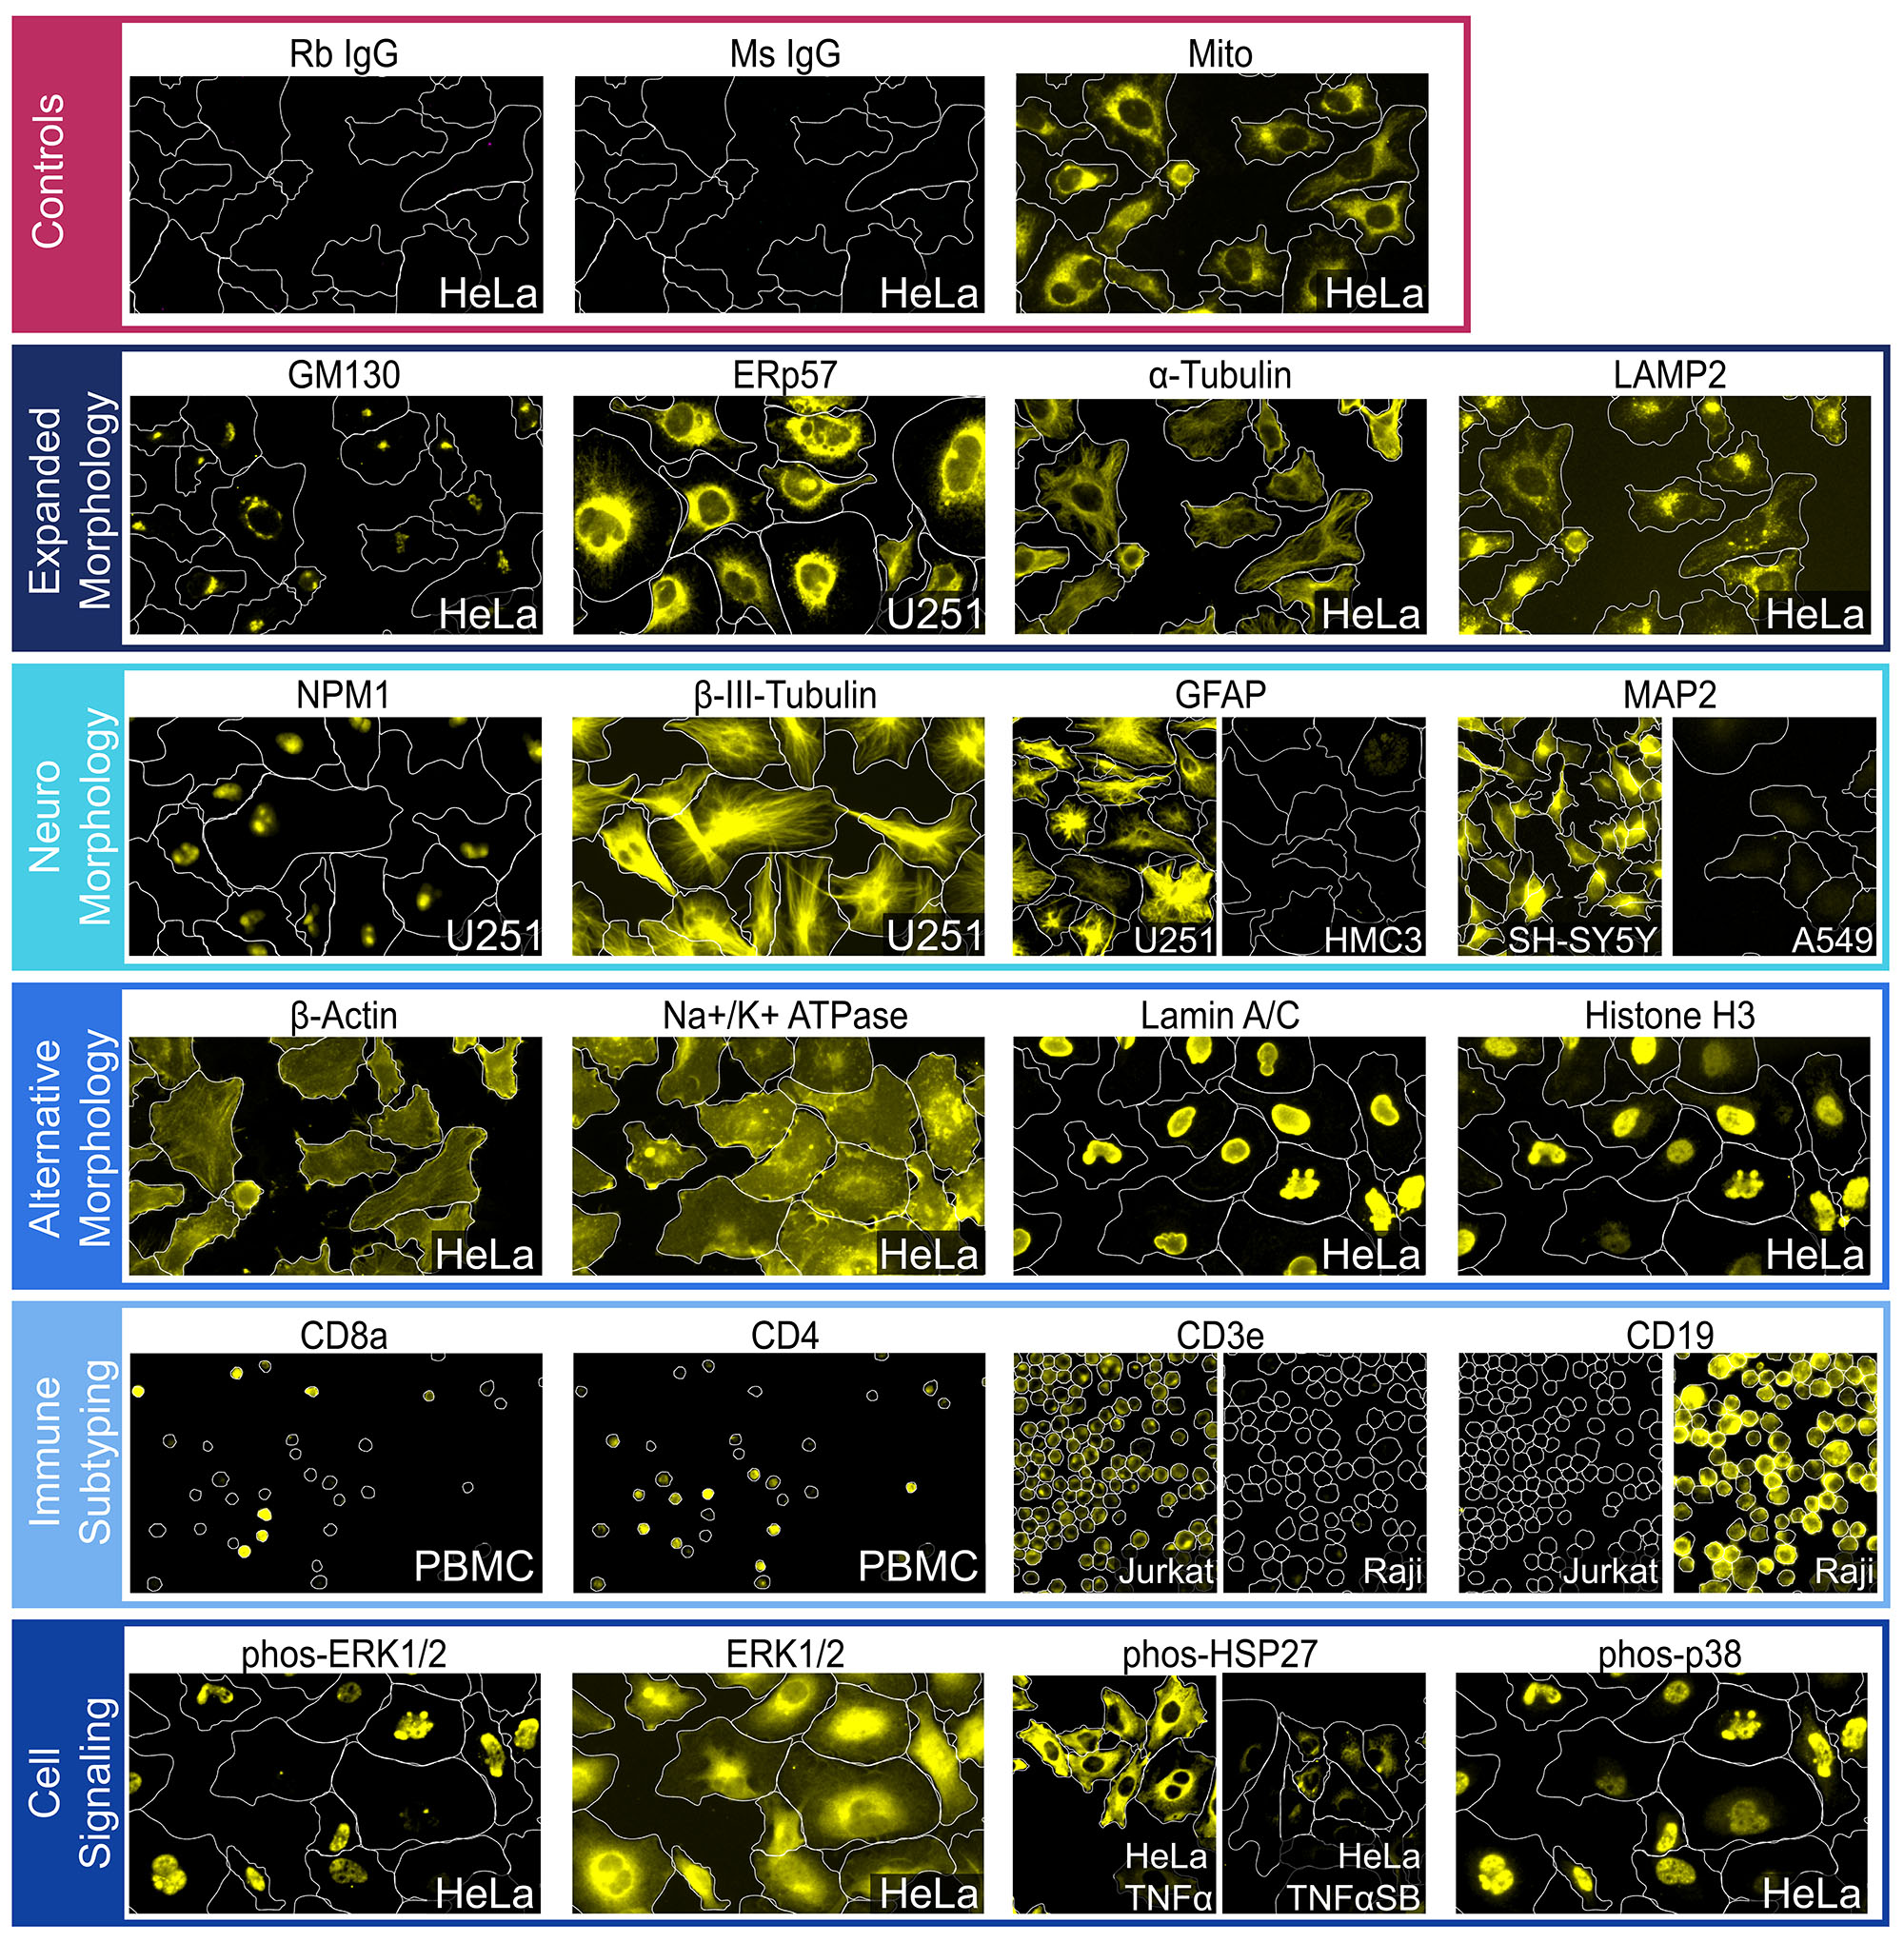
Figure 3. Images from representative protein targets in Cytos panels and controls.
For example:
- From the Expanded Morphology panel, the GM130 target shows signal in the Golgi apparatus1, ERp572 labels the endoplasmic reticulum, α-tubulin labels microtubules, and LAMP23 labels the lysosome.
- From the Neuro Morphology panel, NPM14 is localized to the nucleoli in the nucleus, βIII-tubulin5 labels the microtubules, the astrocyte marker GFAP target is clearly present in U-251 which endogenously expresses GFAP6, but not in the microglia cell line HMC37, and the neuronal marker MAP2 is present in SH-SY5Y8 but not in the lung cell line A549.
- From the Alternative Morphology panel, β-Actin labels the actin filaments, Na+/K+ ATPase labels the cell membrane9, and Histone (H3) and Lamin A/C show strong nuclear signal10.
- From the Immune Subtyping panel, the CD8 and CD4 images highlight non-overlapping subpopulations of CD8-positive and CD4-positive cells in PBMCs (peripheral blood mononuclear cells), which contain leukocytes such as T cells, B cells, and monocytes11. CD3 specifically labels the Jurkat (T-Cell lineage) and CD19 specifically labels Raji (B-Cell lineage).
- From the Cell Signaling panel, the phospho-HSP27 target is clearly induced with TNFα treatment, then reduced when an SB202190 inhibitor is added12,13. Phospho-ERK1/214 is localized to the nucleus and shows single cell differential expression while ERK1/2 is diffuse across the cytoplasm. Similarly, phospho-p3815 is localized to the nucleus as expected.
As expected, the negative controls in Figure 3 show extremely low signal compared to the positive control, which is the mitochondrial signal in the third image in the control panel. To assess individual images and see a detailed assessment of each available Cytos protein panel target, see the Protein Catalog.
Detection Performance and Reproducibility
To account for localization of targets, Intensity Above (Otsu-defined) Threshold (IAT), the intensity of the fraction of pixels whose target signal clears an otsu- defined threshold, was used to ensure intensities are only derived from ‘positive’ pixels. IAT of a given target compared against the same measure for a negative control (acceptance criterion: IAT_target / IAT_negative ≥ 2.0) represents a clearly distinguishable signal. For a subset of targets, fold-change between a positive- and negative-expressing condition or cell type was also evaluated.
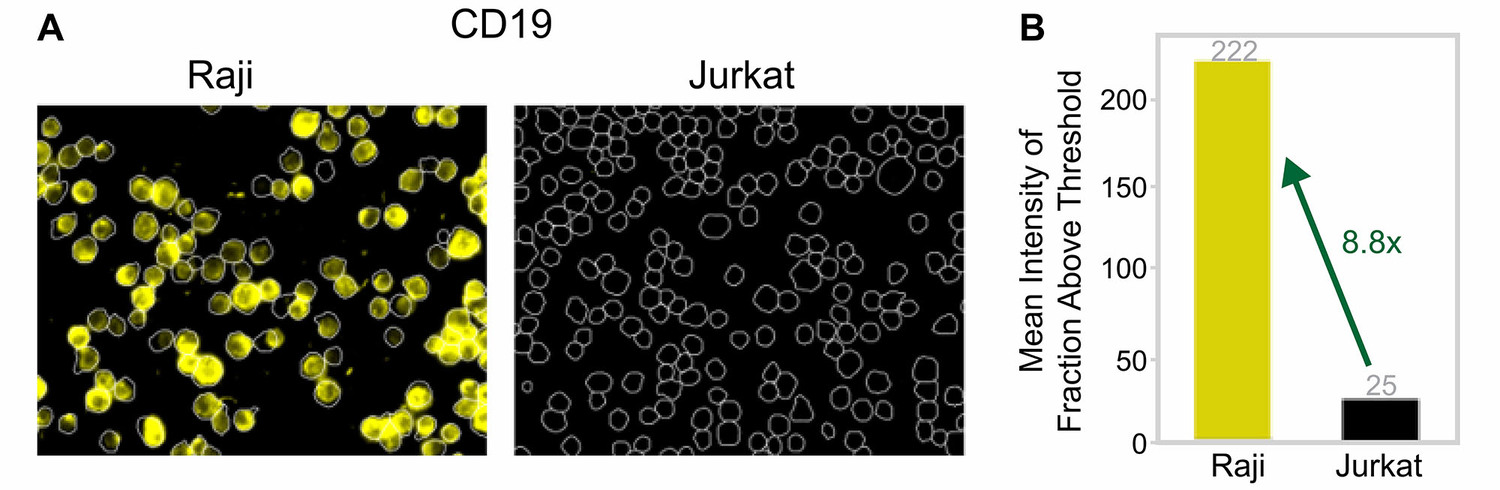
Figure 4. Comparison of images and mean intensity above threshold (IAT) for CD19 target in Raji and Jurkat cells.
Figure 4 shows an example with Cytos images and mean intensity above threshold for the CD19 target for Raji and Jurkat cells. As expected, CD19 is expressed in Raji cells but not in Jurkat cells, and this is reflected both qualitatively (Figure 4A) and quantitatively (Figure 4B). See the morphology panel reference images in Figure 3 and the Protein Catalog for additional examples and analysis details.
Run-to-run reproducibility was evaluated with an acceptance threshold R² > 0.9, and it exceeded this threshold for all panels tested. For each imaging panel, reproducibility was assessed by comparing the mean IAT for a given antibody target produced across independent replicate runs. Within each run, the average per-well fluorescence intensity for every target in the panel was plotted against the matching target's intensity from another run of the same layout to calculate the Pearson correlation coefficient (r). Squaring that value gives the R² (coefficient of determination), which reports the fraction of the variation in one run's signal that is explained by the other run's signal.
Figure 5. Signal stability of two repeat-probed protein targets across 10 imaging cycles. Histone (H4) is read out in red and β-Actin in green. Nuclear ratio: nuclear IAT / (nuclear + cytoplasmic IAT), a localization metric independent of overall signal strength. Variance per target is represented by Standard Error of the Mean across 12 wells; each well's value is the median over its cells before averaging across wells.
Crosstalk was also assessed to ensure measurements are specific and no interaction between target probes occurs. Figure 5 shows the nuclear ratio across cycles for Histone (H4) and β-actin, targets that localize to nuclear and cytoplasmic compartments, respectively. Presence of crosstalk would show convergence to a nuclear ratio of 50%, while stable measurements across cycles indicate no crosstalk.
Summary
The Cytos detection chemistry uses cyclic immunofluorescence to support up to 20 protein targets cycled through sequential 2-plex stain, image, and signal removal steps. Across the tested protein panels, targets showed IAT-to-negative-control ratios well above the ≥ 2.0 acceptance threshold, subcellular localization consistent with the literature in every case tested, and run-to-run reproducibility of R² > 0.9. Side-by-side comparison with a reference immunofluorescence method showed high concordance across all 20 targets evaluated. Together, these data support the use of the Cytos protein workflow on AVITI24 for multiplexed, per-cell protein detection alongside onboard cell paint morphology and RNA sequencing on the same instrument.
References
- Nakamura N, Rabouille C, Watson R, Nilsson T, Hui N, Slusarewicz P, Kreis TE, Warren G. Characterization of a cis-Golgi matrix protein, GM130. J Cell Biol. 131, 1715-1726 (1995).
- Coe, H. & Michalak, M. ERp57, a multifunctional endoplasmic reticulum resident oxidoreductase. Int. J. Biochem. Cell Biol. 42, 796–799 (2010).
- Li, J. & Pfeffer, S. R. Lysosomal membrane glycoproteins bind cholesterol and contribute to lysosomal cholesterol export. eLife 5, e21635 (2016).
- Borer, R. A., Lehner, C. F., Eppenberger, H. M. & Nigg, E. A. Major nucleolar proteins shuttle between nucleus and cytoplasm. Cell 56, 379–390 (1989).
- Lee, M. K., Tuttle, J. B., Rebhun, L. I., Cleveland, D. W. & Frankfurter, A. The expression and posttranslational modification of a neuron-specific β-tubulin isotype during chick embryogenesis. Cell Motil. 17, 118–132 (1990).
- Mondal, S., Dirks, P. & Rutka, J. T. Immunolocalization of Fascin, an Actin‐Bundling Protein and Glial Fibrillary Acidic Protein in Human Astrocytoma Cells. Brain Pathol. 20, 190–199 (2010).
- Dello Russo, C. et al. The human microglial HMC3 cell line: where do we stand? A systematic literature review. J. Neuroinflammation 15, 259 (2018).
- Shipley, M. M., Mangold, C. A. & Szpara, M. L. Differentiation of the SH-SY5Y Human Neuroblastoma Cell Line. J. Vis. Exp. 53193 (2016).
- Xie, J. X., Li, X. & Xie, Z. Regulation of renal function and structure by the signaling Na/K-ATPase: Renal Function and Structure Regulation by NA/K-ATPase. IUBMB Life 65, 991–998 (2013).
- Vahabikashi, A., Adam, S. A., Medalia, O. & Goldman, R. D. Nuclear lamins: Structure and function in mechanobiology. APL Bioeng. 6, 011503 (2022).
- Kleiveland, C. R. Peripheral Blood Mononuclear Cells. in The Impact of Food Bioactives on Health (eds Verhoeckx, K. et al.) 161–167 (Springer International Publishing, Cham, 2015).
- Lopes, L. B. et al. Inhibition of HSP27 phosphorylation by a cell-permeant MAPKAP Kinase 2 inhibitor. Biochem. Biophys. Res. Commun. 382, 535–539 (2009).
For implementation details, see the Cytos Protein User Guide.
For Research Use Only. Not for use in diagnostic procedures.
LT-00085 | Rev A | October 2026