Question
What is Occupancy Score and how should I use it?
Answer
The Occupancy Score is a measure of image saturation as a function of library loading. It is reported per lane and is based on raw polony density. When evaluated alongside pass filter rate (%PF), Q-score, and read output, the Occupancy Score helps determine whether a run has been appropriately loaded, underloaded, or overloaded.
Summary
- AVITI™: The optimal Occupancy Score range is generally 88–92%.
- AVITI24™: The optimal Occupancy Score range is generally 92–96%.
- Values below these ranges indicate underloading, while values above these ranges indicate overloading when supported by the other run metrics.
- The Occupancy Score identifies the direction of loading optimization. It does not provide a direct calculation for how much the loading concentration should be increased or decreased.
Considerations
The optimal Occupancy Score range depends on the sequencing system being used: 88–92% for AVITI and 92–96% for AVITI24. When Occupancy Score is within the optimal range, increasing the loading concentration further is unlikely to improve sequencing output and increases the risk of overloading. Use the Occupancy Score together with total sequencing output, % Q30, and % PF to assess how loading is contributing to run performance.
When to increase or decrease loading concentration
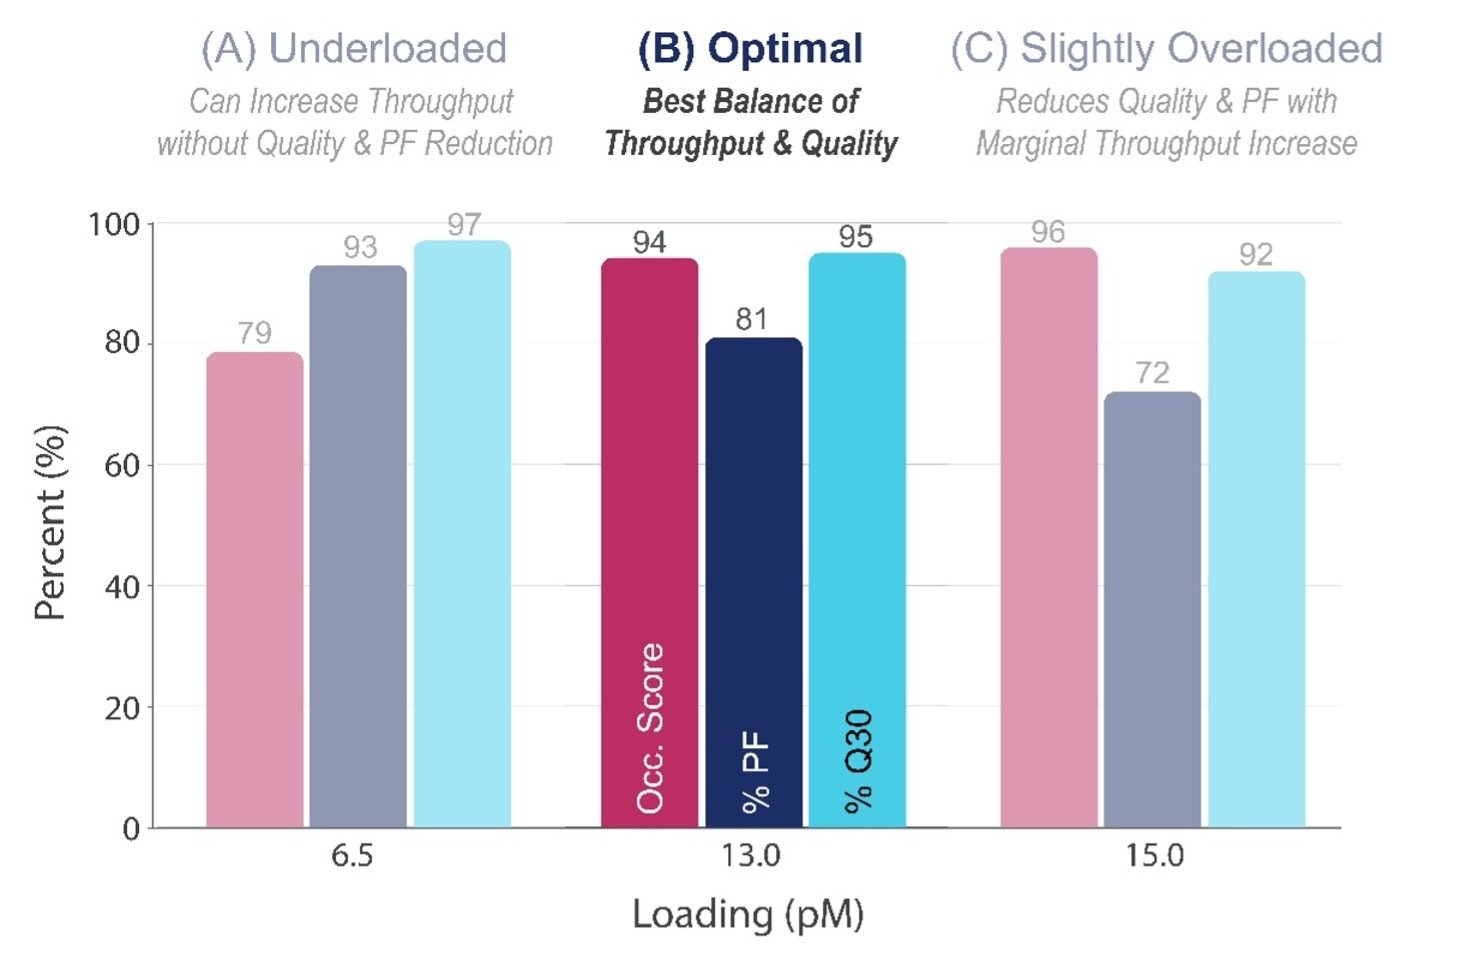
Table 1 provides recommended loading adjustments based on Occupancy Score and other run metrics. Figure 1 provides a visual representation of Occupancy Score, % Q30, and % PF for underloaded, optimal, and overloaded runs.
Table 1. Recommended loading adjustments based on Occupancy Score and overall run performance for AVITI and AVITI24.
|
Output |
% Q30 |
% PF |
Occupancy Score |
Mitigation |
|
|
|
AVITI |
AVITI24 |
|
||
|
Below specifications |
> 90% |
High* |
< 88% |
< 92% |
Run is underloaded, as shown in Figure 1A. Review library quantification and increase loading concentration. |
|
Meets specifications |
> 90% |
High |
88–92% |
92–96% |
Loading is optimal (Figure 1B). |
|
Below specifications |
< 90% |
Low |
> 92% |
> 96% |
Run is overloaded (Figure 1C). Reduce loading or disable HD mode, if applicable. |
|
Contact Technical Support if none of the scenarios above describe your run performance. |
|||||
*% PF is influenced by library characteristics, including base diversity, insert size, and application complexity. A % PF of ≥ 80% is generally considered high, although expected values can vary by library type and application.
Figure 1. Relationship between library loading concentration, sequencing quality, percent passing filter (% PF), and Occupancy Score for E. coli libraries sequenced on the AVITI24 System. Occupancy Score increases with library loading concentration, while % PF decreases as loading approaches and exceeds the optimal range.