Protein Overview
HSP27 (HSPB1) is a small heat shock protein and chaperone that regulates actin cytoskeletal dynamics, apoptosis resistance, and protein-folding stress responses. Ser78 is phosphorylated by MAPKAPK2/3 downstream of the p38 MAPK stress-signaling pathway, shifting HSP27 from large oligomers to smaller dimers/monomers and altering its chaperone/actin-capping activity.
Expected Localization
Unphosphorylated HSP27 is largely cytoplasmic, often as large oligomers.
Upon phosphorylation/stress activation, HSP27 redistributes to associate with the actin cytoskeleton/stress fibers and can show increased perinuclear/nuclear accumulation under stress.
Expected Expression Pattern
Broadly expressed, with particularly high levels in smooth muscle, cardiac and skeletal muscle, and epithelial cells. Phospho-Ser78 signal is detectable at baseline in HeLa cells and is further increased by heat shock, osmotic/oxidative stress, UV irradiation, TNF-α/IL-1, and pharmacologic p38 activators such as anisomycin.
Relevant Pathways
- p38 MAPK stress-activated signaling cascade
- MAPKAPK2/3 (MK2/MK3) downstream kinase signaling
- Actin cytoskeleton remodeling/stabilization
- Cellular stress response and thermotolerance
- Inflammatory cytokine signaling (TNF-α, IL-1)
Clone Information
Antibody Species: Rabbit
Cell Type Compatibility: Validated in human cells only using Cytos™ kits.
For more details on the clone and reactivity with other species, visit ABclonal and search for the clone catalog # AP1032BC.
Qualitative Results
Localization Assessment
Phospho-HSP27 (S78) protein panel demonstrates strong cytoplasmic localization. The observed localization of Phospho-HSP27 (S78) protein is consistent with published data.
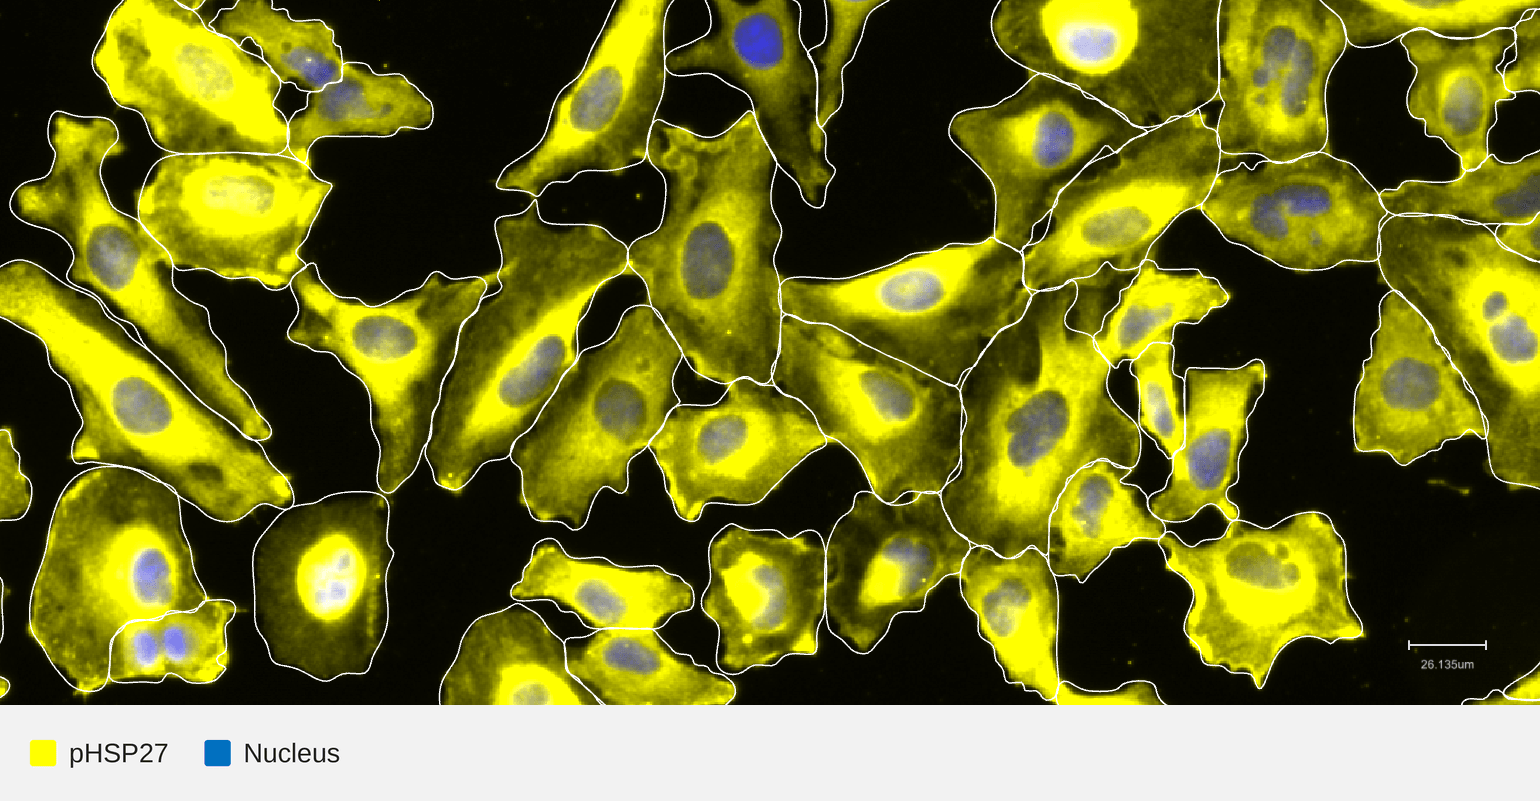
HeLa TNFα 30 min |
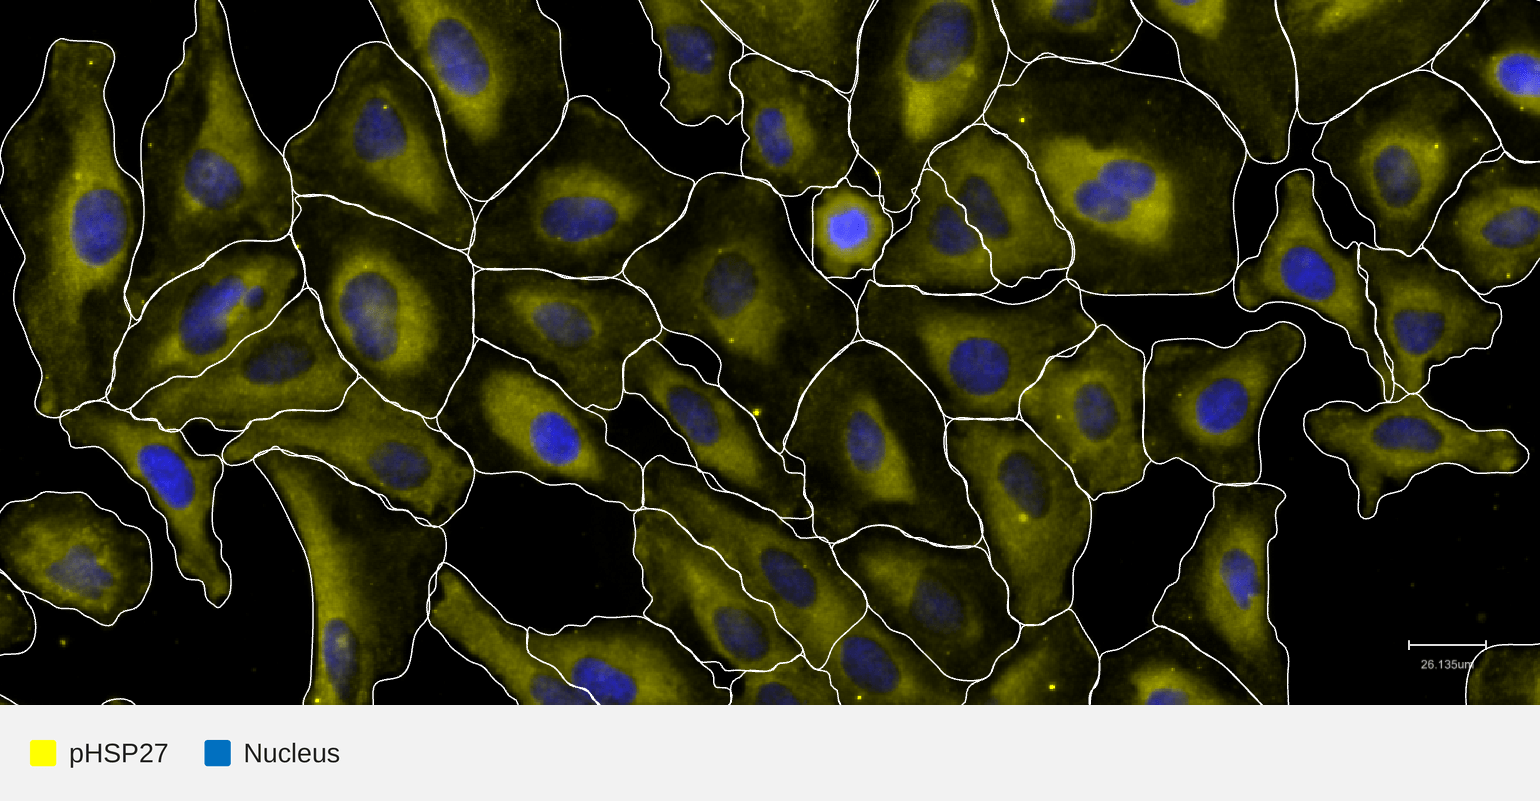
HeLa TNFα 30 min + LPP |
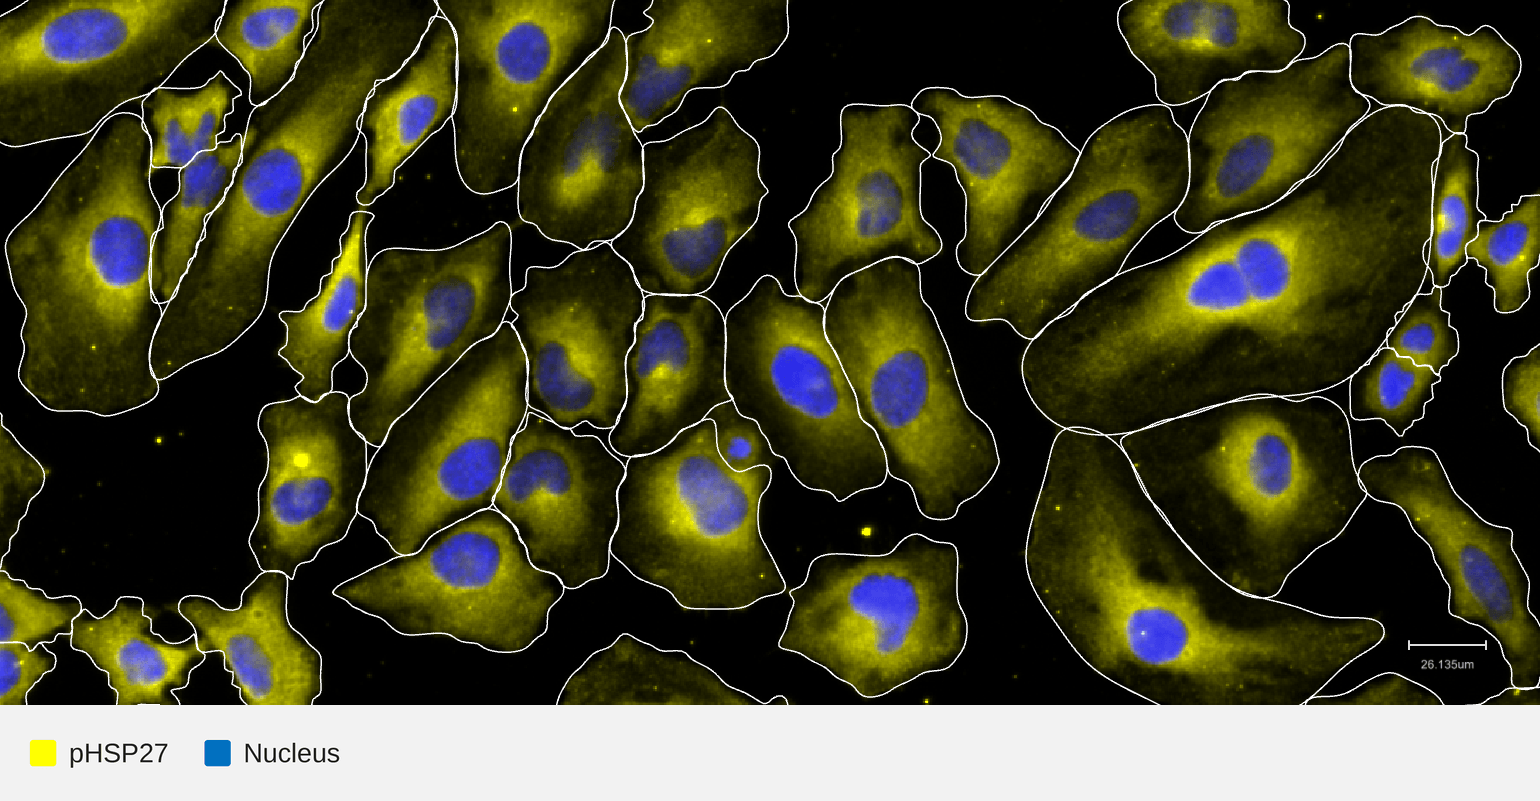
Untreated HeLa |
HeLa cells were cultured in a 12-well format Cytos slide kit overnight, treated with 100 ng/mL TNFα for 30 min, fixed with 4% formaldehyde for 30 minutes, permeabilized using 70% ethanol for 10 minutes, and then treated with Lambda Phosphatase (LPP, NEB P0753L) at 30 °C for 1 hour. After that, cells were incubated with probe made with biotinylated rabbit monoclonal anti-Phospho-HSP27 (S78) antibody for 1 hour at room temperature. Negative control probe based on Biotin Rabbit Isotype Control (ABclonal AC042BC) was included to assess background signal and potential crosstalk, with no detectable crosstalk observed. The slide kit was then assembled into a flow cell and loaded onto an AVITI24™ along with the Cytos Protein Cartridge for a multiomics cell screening run. Phospho-HSP27 (S78) demonstrated strong cytoplasmic localization, induction by TNFα and digestion by LPP, and high signal-to-noise ratio, with no detectable probe crosstalk. These results support high confidence in target-specific detection and validate this antibody as a passing clone.
Quantitative Results
| Signal-to-noise ratio Acceptance criteria: > 2x background |
Pass |
- 27.3 (HeLa, TNFα 30 min)
- 14.6 (Untreated HeLa)
- 13.4 (HeLa, TNFα + SB inhibitor 30 min)
- 10.7 (HeLa, TNFα 30 min, +LPP)
Indicates the fold brightness of the target signal as measured by the Mean Intensity Above (Otsu-defined) Threshold (IAT), over the background (a channel-matched isotype control) in the same cell. The untreated-baseline ratio is already 14.63, nearly 7 times the acceptance threshold; 30 minutes of TNFα stimulation increases this further to 27.28 (a ~1.9-fold increase over baseline), while co-treatment with the p38 inhibitor SB203580 (TNFα+SB, 13.35) brings the signal back down near the untreated baseline, consistent with p38-dependent phosphorylation. Lambda Phosphatase (LPP) digestion of the TNFα-stimulated sample reduces the ratio to 10.73 (a ~61% reduction from the TNFα-stimulated value), confirming that the signal is phospho-specific.
|
Panel-level run-to-run reproducibility |
Pass |
For each imaging panel, we assess reproducibility by comparing the intensity signal a given antibody target produces across independent replicate runs. Within each run, we measure the average per-well fluorescence intensity for every target in the panel. We then plot each target's intensity from one run against the matching target's intensity from another run of the same layout, and calculate the Pearson correlation coefficient (r) between those two sets of measurements. Squaring that value gives the R² (coefficient of determination), which reports what fraction of the variation in one run's signal is explained by the other run's signal.
Disclaimer: This information is provided to help assess whether the target suits your experiment. It reflects internal testing conditions and does not guarantee performance in your application. Performance in other cell types and species such as mouse or rat may require additional validation using Cytos kits as performance is not guaranteed.
ELEMENT BIOSCIENCES For Research Use Only. Not for Use in diagnostic procedures.