Alternative Morphology Panel (860-00072)

    Histone H3

    Protein Overview

    Histone H3 is a highly conserved core histone protein which along with histones H2A, H2B, and H4, forms nucleosomes, the fundamental units of chromatin. Histones package genomic DNA and regulate chromatin structure, gene transcription, DNA replication, DNA repair, and chromosome segregation. Histone H3 also undergoes numerous post-translational modifications (e.g., phosphorylation, methylation, acetylation, and ubiquitination) that regulate epigenetic control of gene expression.

    Expected Localization

    Nucleus (chromatin-associated)

    Histone H3 is tightly bound to DNA and produces strong, uniform nuclear staining, with relatively reduced signal in nucleolar regions.

    Expected Expression Pattern

    Ubiquitously expressed in virtually all nucleated eukaryotic cells. Total Histone H3 expression is stable across cell types and experimental conditions, making it a reliable pan-nuclear marker.

    Relevant Pathways

    • Chromatin organization and nucleosome assembly
    • Epigenetic regulation of gene expression
    • DNA replication
    • DNA damage response and repair
    • Cell cycle progression and mitosis
    • Transcriptional regulation
    Mechanotransduction and cell shape/mechanical stress response

    Clone Information

    Antibody Species: Rabbit
    Cell Type Compatibility: Validated in human cells only using Cytos™ kits.

    For more details on the clone and reactivity with other species, visit ABclonal and search for the clone catalog # AC070BCS.

    Qualitative Results

    Localization Assessment

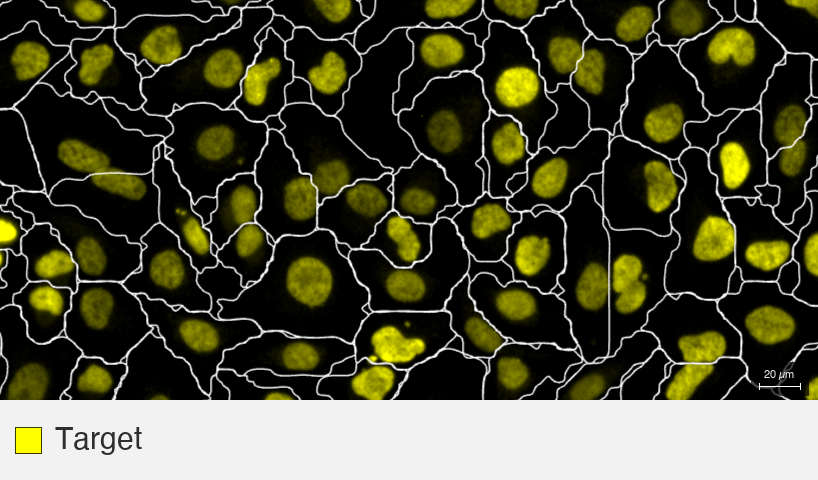
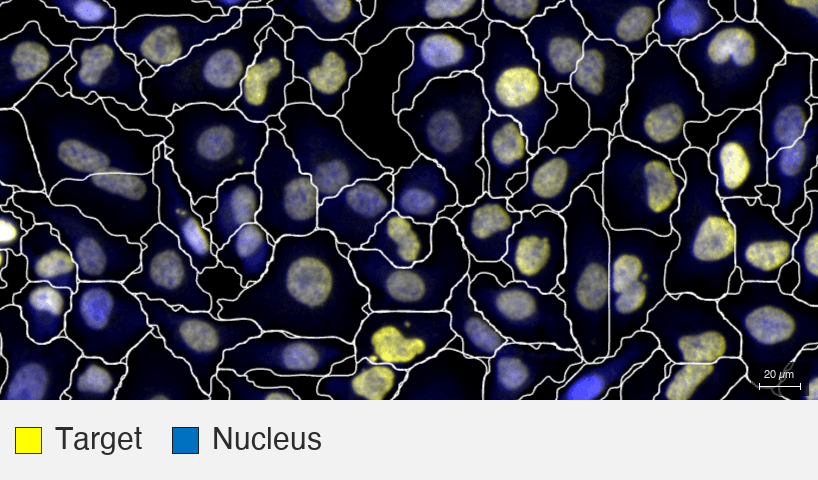
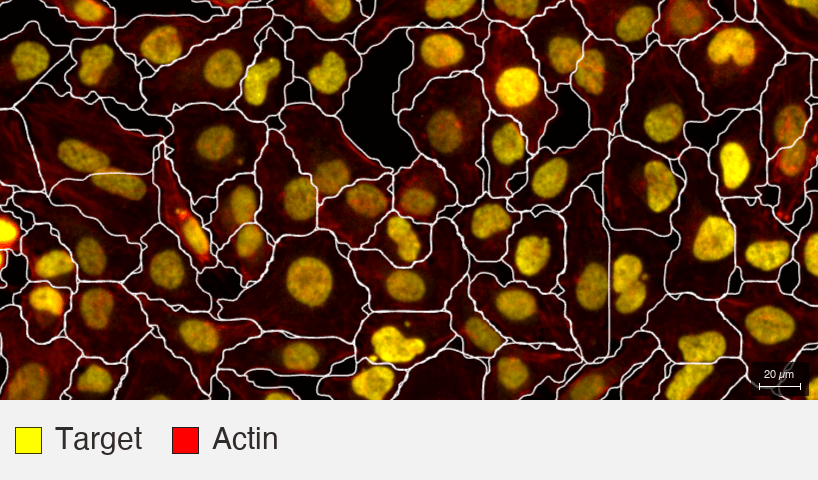
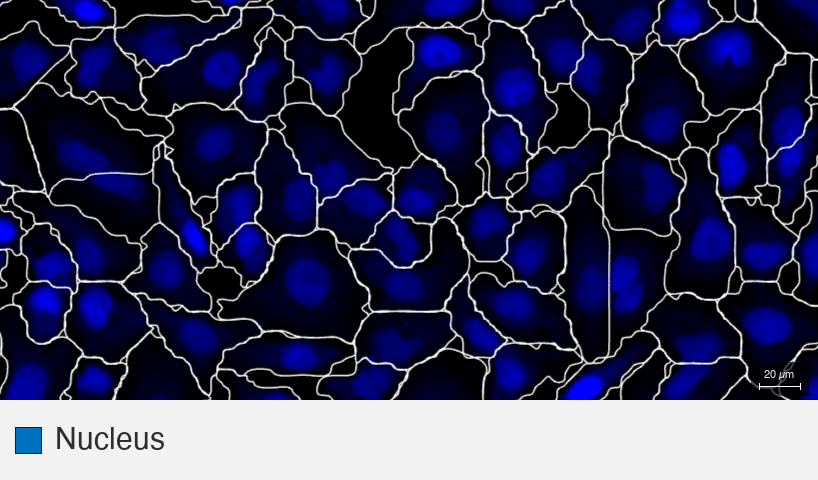
    Histone H3 protein panel demonstrates strong nuclear (nucleoplasm) localization and high signal-to-noise ratio, with no detectable probe crosstalk. The observed localization of Histone H3 protein is consistent with published data.

    • Histone-H3_MBA-0804_HeLa-F1_1_target-only
    • Histone-H3_MBA-0804_HeLa-F1_2_target+nucleus
    • Histone-H3_MBA-0804_HeLa-F1_4_target+actin
    • Histone-H3_MBA-0804_HeLa-F1_3_nucleus-only

    HeLa cells were cultured in a 12-well format Cytos slide kit overnight then fixed with 4% formaldehyde for 30 minutes, permeabilized using 70% ethanol for 10 minutes. The slide kit was then assembled into a flow cell and loaded onto an AVITI24™ along with the Cytos Protein Cartridge for a multiomics cell screening run. Nucleus is stained with Reddot2 and actin is stained with phalloidin using the core morphology panel included in all Cytos kits. SH-SY5Y, HepG2, A549, fibroblast (BJ), U2OS, and Jurkat + Raji (50:50 mixed well) cells were also cultured and processed under the same protocol in parallel as part of Cytos cross-run reproducibility testing.

    Quantitative Results

    Signal-to-noise ratio
    Acceptance criteria: > 2x background
    Pass
    • 11.3 ± 2.8 (HeLa; n=26 runs)
    • 28.0 ± 4.8 (SH-SY5Y; n=3 runs)
    • 8.2 ± 0.2 (HepG2; n=3 runs)
    • 14.7 ± 3.4 (A549; n=34 runs)
    • 22.0 ± 3.4 (Fibroblast (BJ); n=3 runs)
    • 12.1 ± 2.4 (Jurkat + Raji, 50:50 mixed well; n=3 runs)

    Indicates the fold brightness of the target signal as measured by the Mean Intensity Above (Otsu-defined) Threshold (IAT), over the background (a channel-matched isotype control) in the same cell. Data shown are mean ± standard deviation across independent reproducibility runs. The ratio ranges from approximately 8–28 across the seven cell types tested (HeLa, A549, Fibroblast, SH-SY5Y, HepG2, a 50:50 Jurkat+Raji well, and U2OS), indicating that the signal is consistently about 4–14 times above the acceptance threshold — a clean, easily distinguishable signal.

    Panel-level run-to-run reproducibility
    Acceptance criteria: R2 > 0.9  

     Pass

    For each imaging panel, we assess reproducibility by comparing the intensity signal a given antibody target produces across independent replicate runs. Within each run, we measure the average per-well fluorescence intensity for every target in the panel. We then plot each target's intensity from one run against the matching target's intensity from another run of the same layout, and calculate the Pearson correlation coefficient (r) between those two sets of measurements. Squaring that value gives the R² (coefficient of determination), which reports what fraction of the variation in one run's signal is explained by the other run's signal.

    Disclaimer: This information is provided to help assess whether the target suits your experiment. It reflects internal testing conditions and does not guarantee performance in your application. Performance in other cell types and species such as mouse or rat may require additional validation using Cytos kits as performance is not guaranteed.

    ELEMENT BIOSCIENCES For Research Use Only. Not for Use in diagnostic procedures.