Sign up for our newsletter
Join our scientific community to stay up to date with Element news, insights, and product updates.
This site is protected by reCAPTCHA and the Google Privacy Policy and Terms of Service apply.
A common measure of accuracy reported by sequencing platform providers is the fraction of data that exceeds an accuracy of 99.9% (commonly referred to as %Q30). The Element AVITI™ system leverages avidite base chemistry sequencing (ABC) to achieve a high fraction of Q40 data (99.99% accuracy) when applied to PCR-free libraries.1 However, certain applications may benefit from ever higher accuracy, in particular identification of low frequency variant alleles or reference genome refinement.
Setting a new standard, we developed Cloudbreak UltraQ™ with the highest accuracy specification on the market today. With improvements to the sequencing chemistry, a dramatic reduction of library preparation errors, and careful handling of analysis artifacts, UltraQ delivers 70% of reads at or above Q50 (99.999% accuracy) and 90% reads at or above Q40. As the measurement of very low levels of sequencing error is easily impacted by analysis methodology, here we take a deep dive into both our approach to reducing error and how we measured our progress.
How are Quality Scores Calculated?
Quality scores are assigned to each basecall during sequencing by mapping several predictors (such as intensity and phasing rate) to the quality score.2 The mapping is established through a machine learning model applied to multiple sequencing runs of samples from a well-characterized genome. The model inputs consist of the quality predictors for each base and a value of 0 or 1 depending on whether the basecall is an error or not. Any mismatches to the aligned reference sequence are considered errors. Given the predictor values and the correctness of each base, the machine learning algorithm generates the mapping from predictors to quality scores. That mapping is used to assign predicted qualities for all subsequent sequencing runs. Table 1 shows the relationship between quality score and error rate.
|
Quality Score |
Error rate |
|
Q10 |
1 in 10 bp |
|
Q20 |
1 in 100 bp |
|
Q30 |
1 in 1,000 bp |
|
Q40 |
1 in 10,000 bp |
|
Q50 |
1 in 100,000 bp |
Table 1: Defining quality scores as a function of error rate p:
Verifying Quality Scores
However, the assignment of high quality scores to basecalls by a platform does not guarantee those quality scores reflect true accuracy. Quality scores need to be verified by comparing the predicted quality scores to empirically observed accuracy. This can be done using base call quality recalibration (BQSR)3, which is available as part of the Genome Analysis Toolkit (GATK)4 from the Broad Institute. An initial step in BQSR is to consider all bases assigned to a particular quality score, e.g., Q40, and then use alignment to determine the empirical error rate in that population. If the empirical error rate is 1 error per 10,000 bases, then Q40 accurately describes the population. If the error rate is more than 1 in 10,000 bases, the quality score is adjusted up or down to match what was empirically observed. This empirical quality score can be checked against the predicted score. If the predicted scores are accurate, then the plot of predicted vs. recalibrated quality scores is a straight line on the diagonal. Overprediction or underprediction would be characterized as points under or over the diagonal, respectively.[1]
Tracking Down the Sources of Error with E. coli
To attain Q50, we began by making improvements to the sequencing process. The improvements were focused on optimization of the sequencing recipe with respect to reagent concentrations, enzyme contact times, and formulations. These efforts led to higher average quality but did not increase the quality score to our target of Q50 in our benchmarking system. Where was the residual error coming from?
Careful characterization of error modes led us to library prep as the largest remaining barrier to significantly moving the needle on accuracy.5 Library preparation errors happen upstream of sequencing, so they are invisible to quality predictors and have a disproportionate impact on the recalibration of high-quality score assignments. The highest contributor to library prep-induced error was deamination damage, driven by library preps steps involving high heat. When a mutated template is sequenced accurately, a deamination event appears as a C to T base calling error. To mitigate these errors, we used a deamination reagent on the sequencer prior to polony generation. Library fragments with deamination damage (i.e., uracil bases) are digested and generate no sequencing data, eliminating a major source of confounding reads from downstream analysis.
The next highest error mode pertaining to library preparation is driven by end repair. End repair leads to template changes that predominantly show up in the first 15 cycles of R2. To address this, we implemented dark cycling at the beginning of R2, followed by 150 standard cycles. Since DNA fragmentation ahead of library prep is random, the skipped bases in one template are adequately sequenced in other polonies where they are positioned in regions of the template less likely to be compromised.
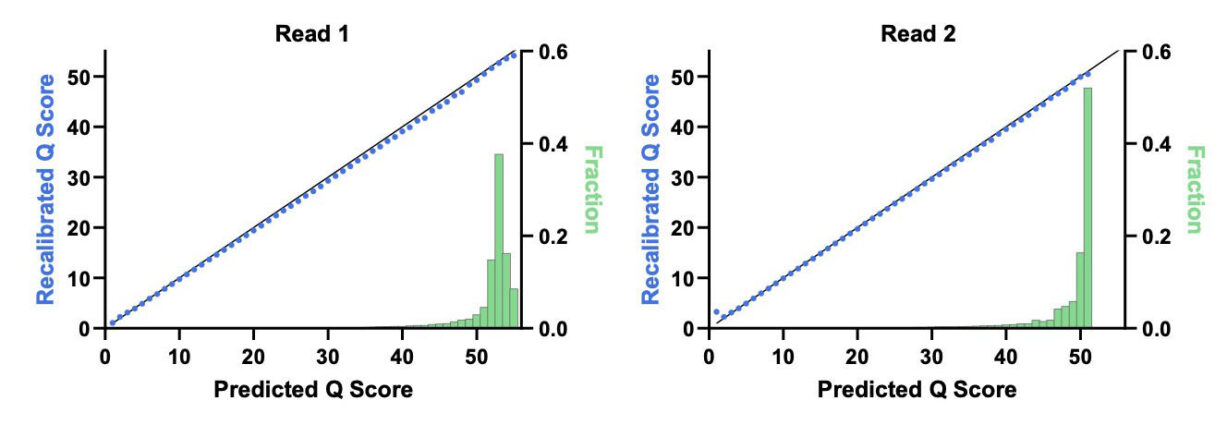
Figure 1 shows the impact of the deamination recovery agent and R2 dark cycling on errors with high quality scores in an E. coli assay that minimizes analysis-related errors. The baseline Cloudbreak chemistry data on the x-axis shows elevated errors in miscalls associated with deamination and erroneous end repair, whereas with UltraQ, on the y-axis, these error types are greatly reduced. With these changes, most bases in the model system exceeded Q50. In Figure 2, we see that the predicted Q scores tightly match recalibrated Q scores in both reads 1 and 2.

From Test Case to Use Case: Human Genome Sequencing
Demonstrating 70% Q50 with E. coli was an important milestone in our development, but bacterial genomes do not have the full contextual complexity of the human genome. However, extending the results to the far more complex human genome adds managing an additional error source: analysis artifacts. Given that errors are determined from alignment, an incorrect alignment can cause BQSR to treat accurately called bases as errors, thus reducing quality scores in the recalibration.
Incorrect alignments can occur due to mis-mapping of short reads to repetitive regions of a genome or because the reference itself is imperfect. Such issues are much easier to mitigate in E. coli where the entire reference genome is well established, and the repeat structure is known and relatively simple. To overcome analysis artifacts when benchmarking against the human genome, we turned to the CHM13 cell line. This cell line provides the full contextual complexity of the human genome but reduces analysis artifacts for two primary reasons. First, the cell line was used in the construction of the highly accurate T2T reference genome, eliminating most assembly errors.6 Second, it is a homozygous cell line, which obviates the need to mask heterozygous variants that could be confused for sequencing errors.
We sequenced the CHM13 cell line with our UltraQ reagents and, for the first time, observed over 70% predicted and over 70% recalibrated Q50 data in human (Figure 3). Table 2 illustrates the percentage of quality scores exceeding Q30, Q40, and Q50. We used third party tools for the recalibration and applied no BED files masking difficult regions of the genome. Instructions for reproducing our results are provided at the end of the blog.

|
Data exceeding Q threshold |
Predicted |
Recalibrated |
|
%Q30 |
97.3% |
96.8% |
|
%Q40 |
92.9% |
91.2% |
|
%Q50 |
74.7% |
72.8% |
Table 2: Percentage of the data exceeding various Q score thresholds. R1 and R2 are averaged.
The development effort to attain over 70% Q50 data as benchmarked against the T2T human reference involved improvements to both library preparation and sequencing. To our knowledge, this is the first time that this has been achieved by any sequencing platform. By using multiple strategies to reduce the most abundant error types, UltraQ provides the firmest possible foundation for the development of highly sensitive assays for human health research.
Furthermore, the Q50 specification was met in both predicted and recalibrated quality scores, establishing a new standard for data quality. With the highest accuracy specification on the market today, UltraQ provides additional flexibility for AVITI users in applications where exceptionally high accuracy may be impactful.
Reproducing our Results
If you would like to reproduce our results or explore the data for CHM13, you can download the FASTQ files. We provide the entire FASTQ as well as a down-sampled version for faster compute. We align with BWA-mem with default parameters to the T2T reference found here: https://github.com/marbl/CHM13. The BQSR command that we use is below:
gatk BaseRecalibrator --preserve-qscores-less-than 0 -R chm13v2.0.fa -I GAT-ULTRAQ-L013.deduped.bam --known-sites chm13v2.0_known-sites.vcf.gz -O output.table
We compute recalibrated values using a “known sites” file that is blank (except for headers) but required by BQSR. We include it along with the raw data for ease of replication of our results.
What are the CHM13 cell line and the T2T reference?
The CHM13 cell line is derived from a complete hydatidiform mole (CHM), a rare event post fertilization where maternal DNA is lost and the paternal DNA is duplicated in its place, resulting in nearly uniform homozygosity across the entire genome. The simplified genome structure made it a natural choice for the Telomere to Telomere (T2T) Consortium to use for reference refinement. The T2T consortium used multiple sequencing technologies to generate gapless assemblies for all chromosomes (except Y) and correct error in the prior reference. Given the exceptional quality of the reference and the availability of the DNA that was used to generate the reference, sequencing CHM13 offers an ideal path to evaluating data quality in human, while avoiding nearly all analysis artifacts.
What is dark cycling?
Dark cycling refers to the ability to move along the DNA template strand without identifying the underlying bases. Because ABC separates the chemistry steps of base identification (avidity) and movement along the template (stepping), it is possible to omit avidity and imaging in specified cycles. Dark cycling iterates the incorporation of unlabeled, terminated nucleotides with removal of the block. Dark cycles take half the time of standard cycles, do not expose the DNA to additional rounds of laser light, and enable the user to skip over unnecessary or problematic regions of the template.
- Arslan S, Garcia FJ, Guo M, et al. Sequencing by Avidity Enables High Accuracy with Low Reagent Consumption. Nat Biotechnol 42, 132–138 (2024). https://www.nature.com/article...
- Ewing B, Green P. Base-calling of automated sequencer traces using phred. II. Error probabilities. Genome Res. 1998;8(3):186-194.
- Van Der Auwera GA, Carneiro MO, Hartl C, et al. From FastQ Data to High‐Confidence Variant Calls: The Genome Analysis Toolkit Best Practices Pipeline. Curr Protoc Bioinforma. 2013;43(1). doi:10.1002/0471250953.bi1110s43
- McKenna A, Hanna M, Banks E, et al. The Genome Analysis Toolkit: A MapReduce framework for analyzing next-generation DNA sequencing data. Genome Res. 2010;20(9):1297-1303. doi:10.1101/gr.107524.110
- Kruglyak S, Altomare A, Ambroso M, et al. Characterizing and addressing error modes to improve sequencing accuracy. Published online February 5, 2024. doi:10.1101/2024.02.01.578321
- Nurk S, Koren S, Rhie A, et al. The complete sequence of a human genome. Science. 2022;376(6588):44-53. doi:10.1126/science.abj6987
[1]A further refinement in BQSR is to consider a set of covariates (e.g., position in the read, sequence context of the base) as well as the mismatch information as input into a logistic regression to refine the quality score values.