
Polysaccharides Obtained from Cordyceps militaris Alleviate Hyperglycemia by Regulating Gut Microbiota in Mice Fed a High-Fat/Sucrose Diet

 , and
, and 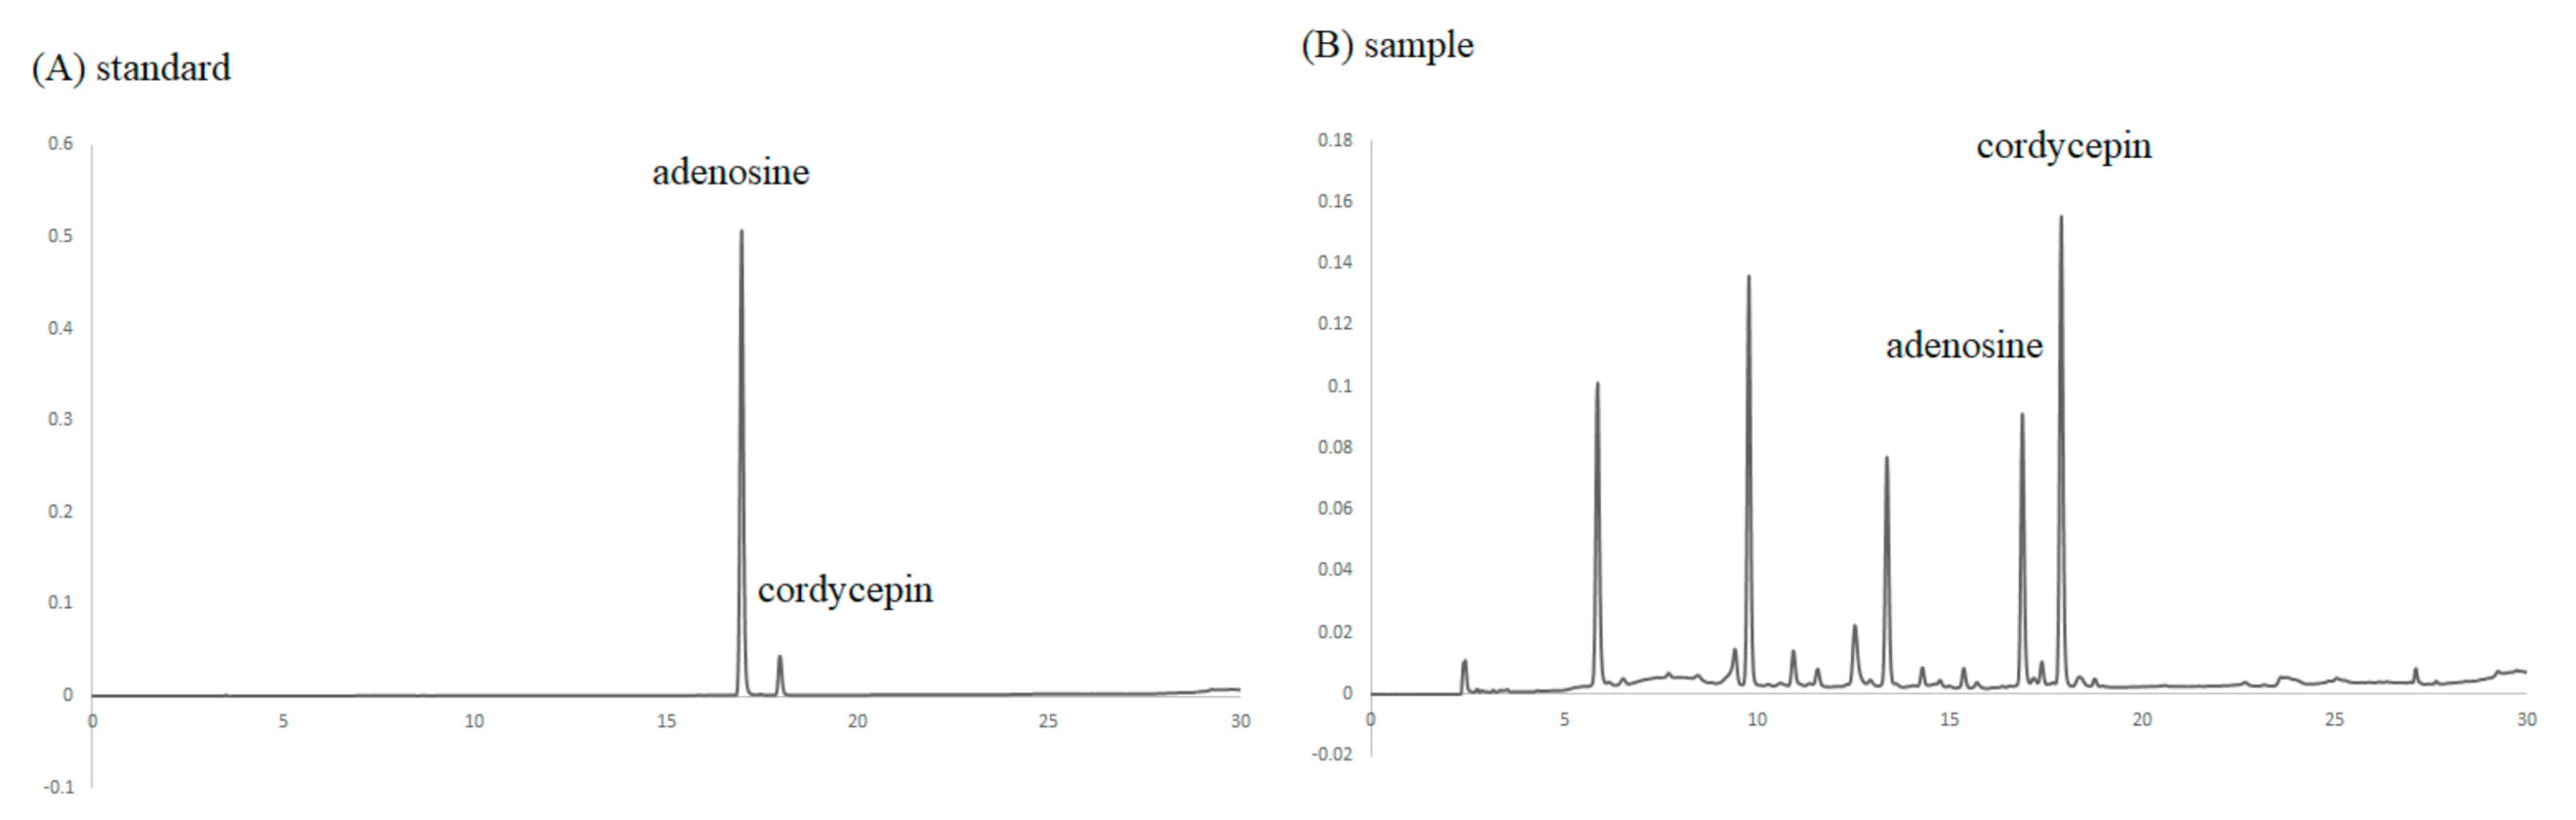
Abstract
:1. Introduction
2. Materials and Methods
2.1. Chemicals
2.2. Sample Preparation
2.3. High Performance Liquid Chromatography (HPLC) Assay for Cordycepin Level
2.4. Western Blotting
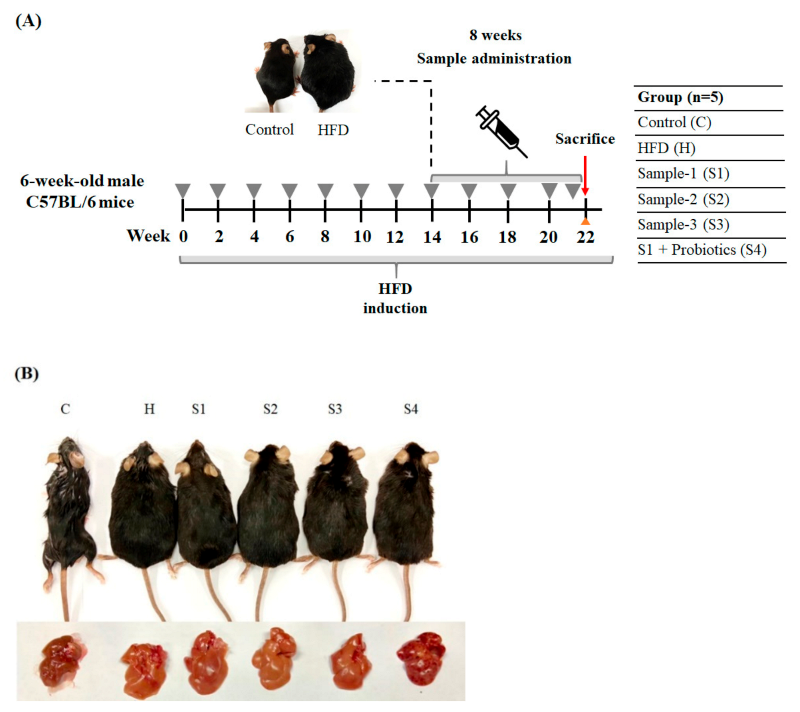
2.5. Animal Experiment
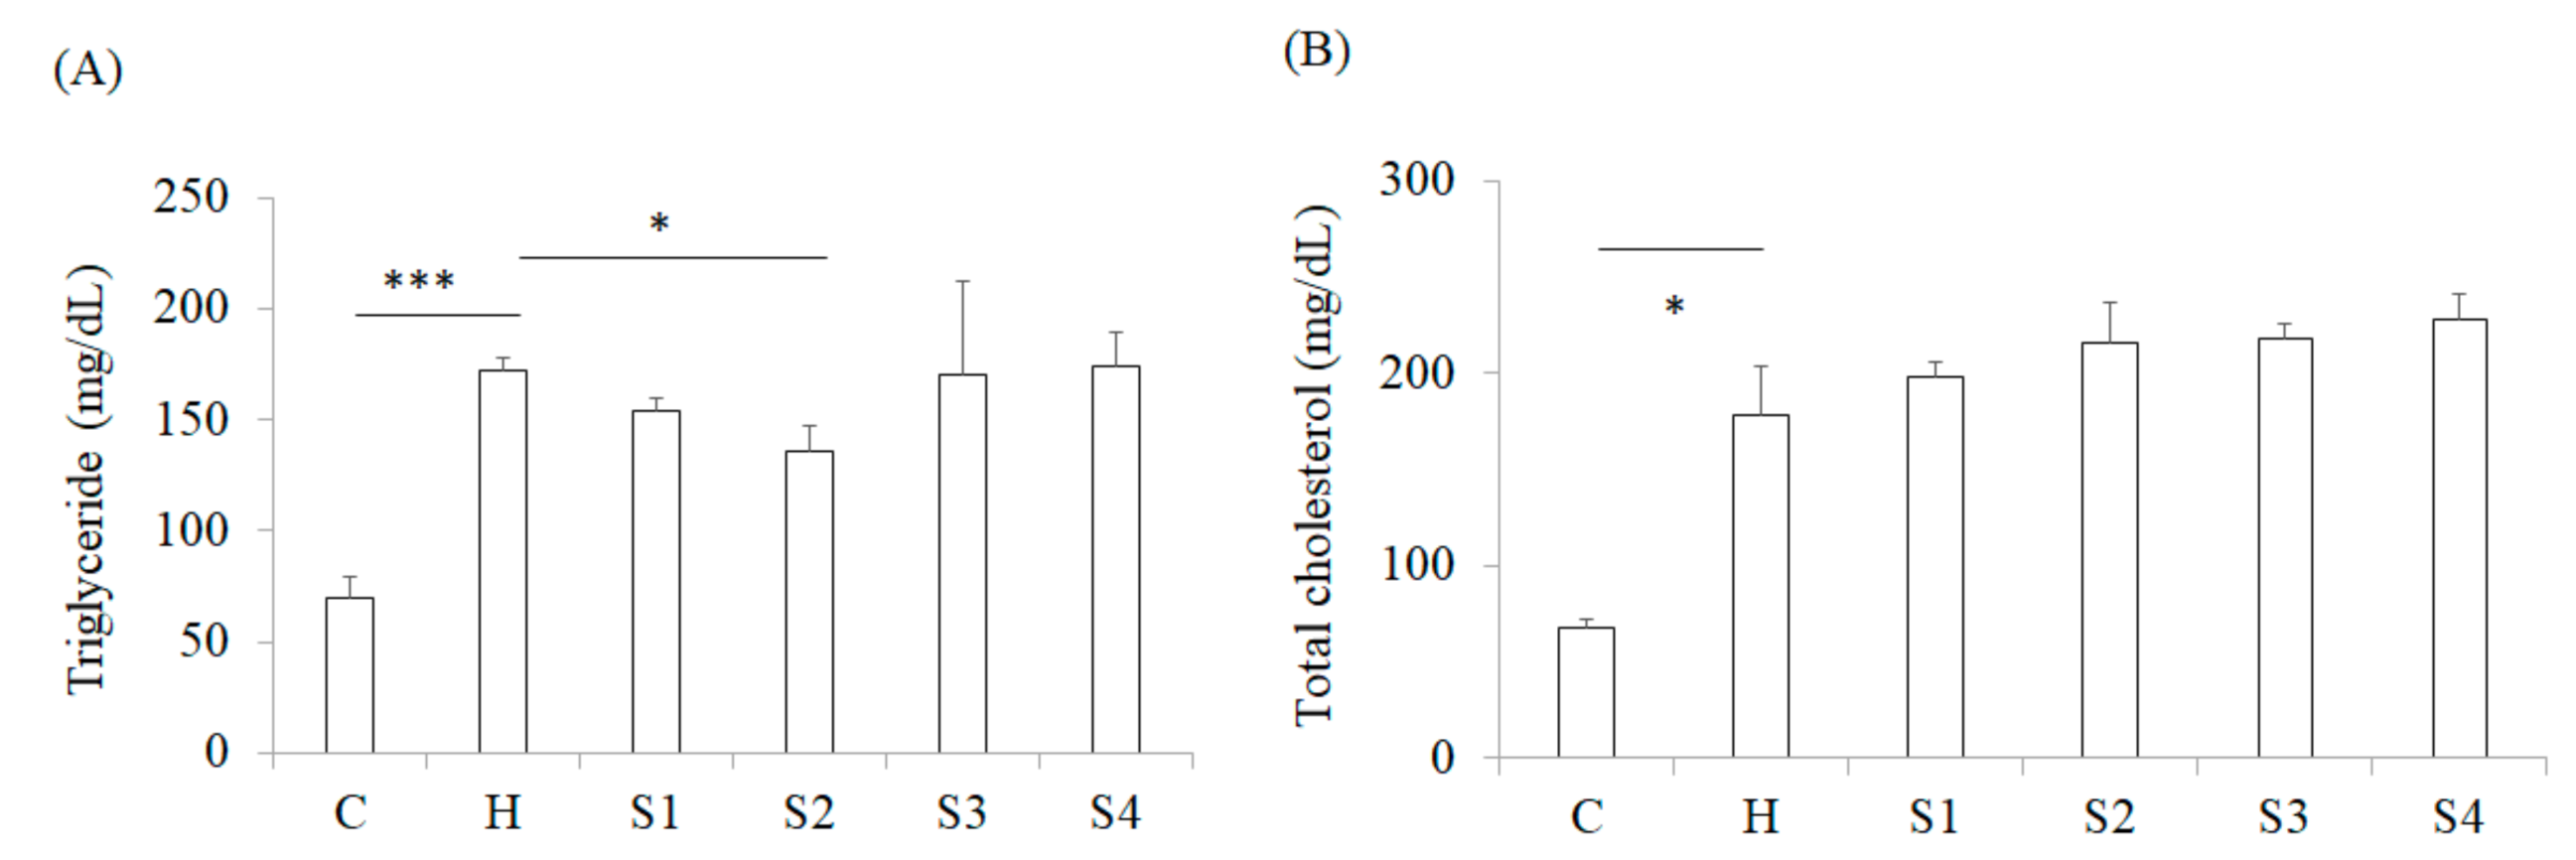
2.6. Assays for Serum Triglyceride and Total Cholesterol
2.7. The Hematoxylin and Eosin (H&E) Stain
2.8. Periodic Acid Schiff (PAS) Stain
2.9. Assay for Gut Microbiota
2.10. Statistical Analysis
3. Results and Discussion
3.1. Analyzing the Levels of Cordycepin in C. militaris
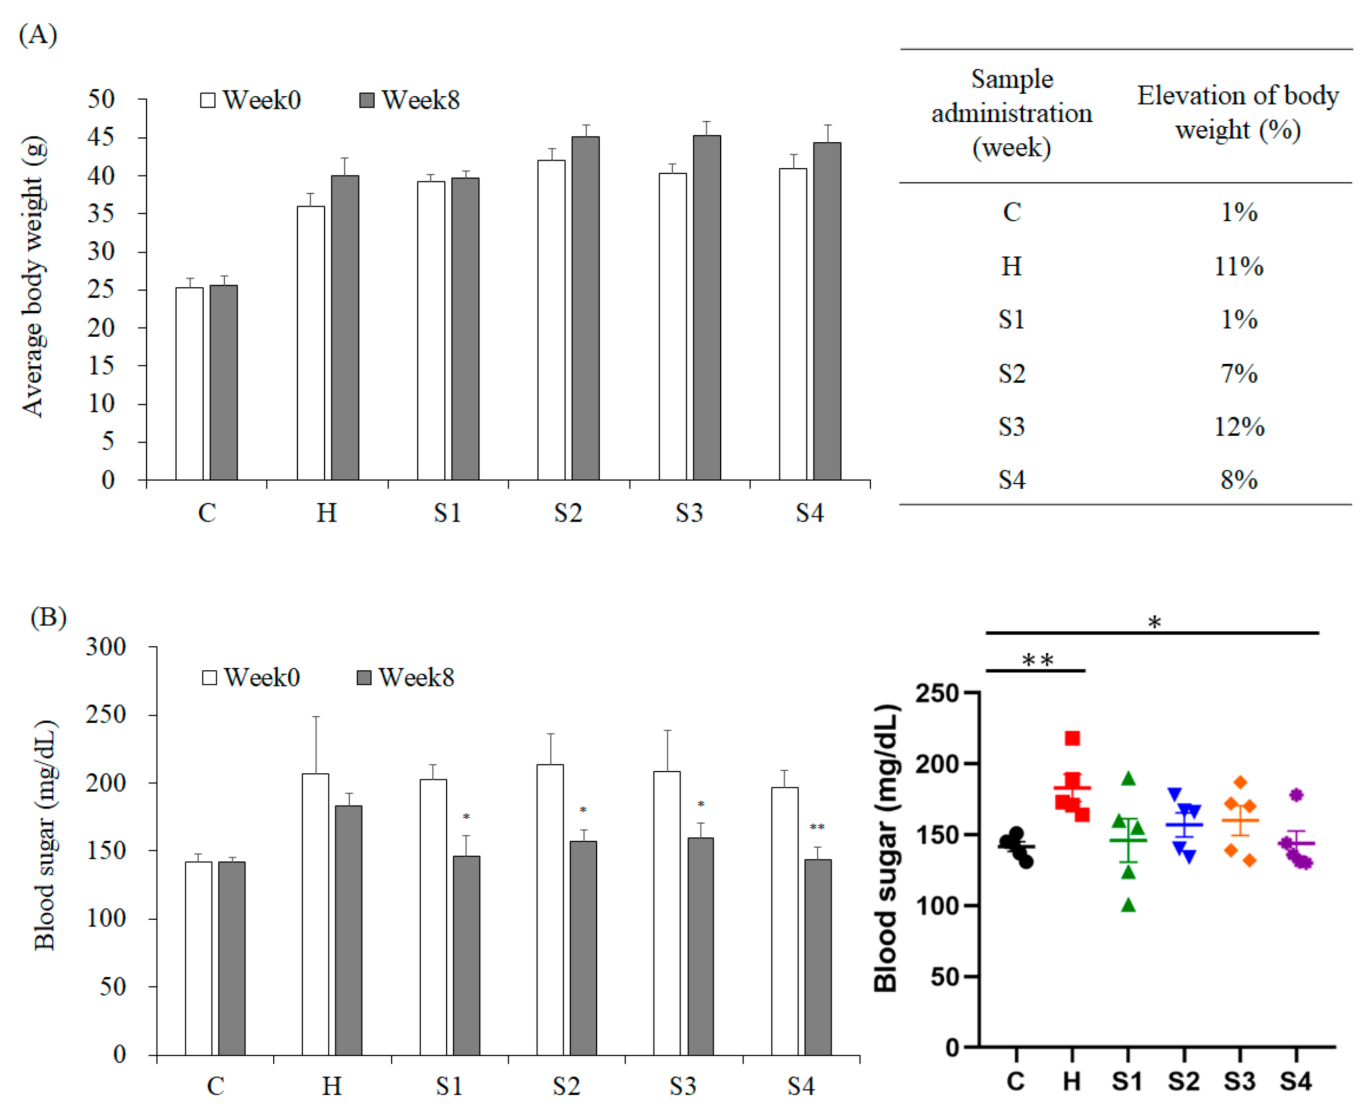
3.2. The Effects of C. militaris on Lowering Blood Glucose, TG, and TC Levels in High Fat/Sucrose Diet (HFSD)-Induced Mice
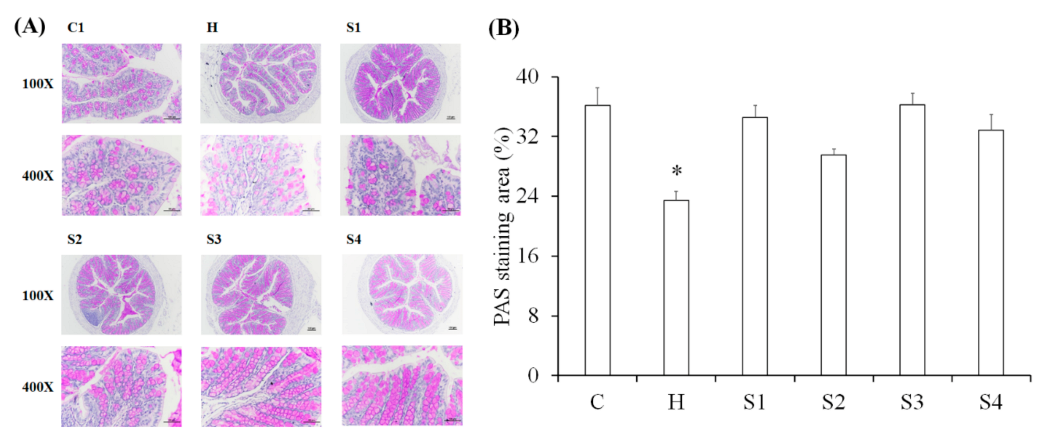
3.3. The Protection of C. militaris on Intestinal Function in HFSD-Induced Mice
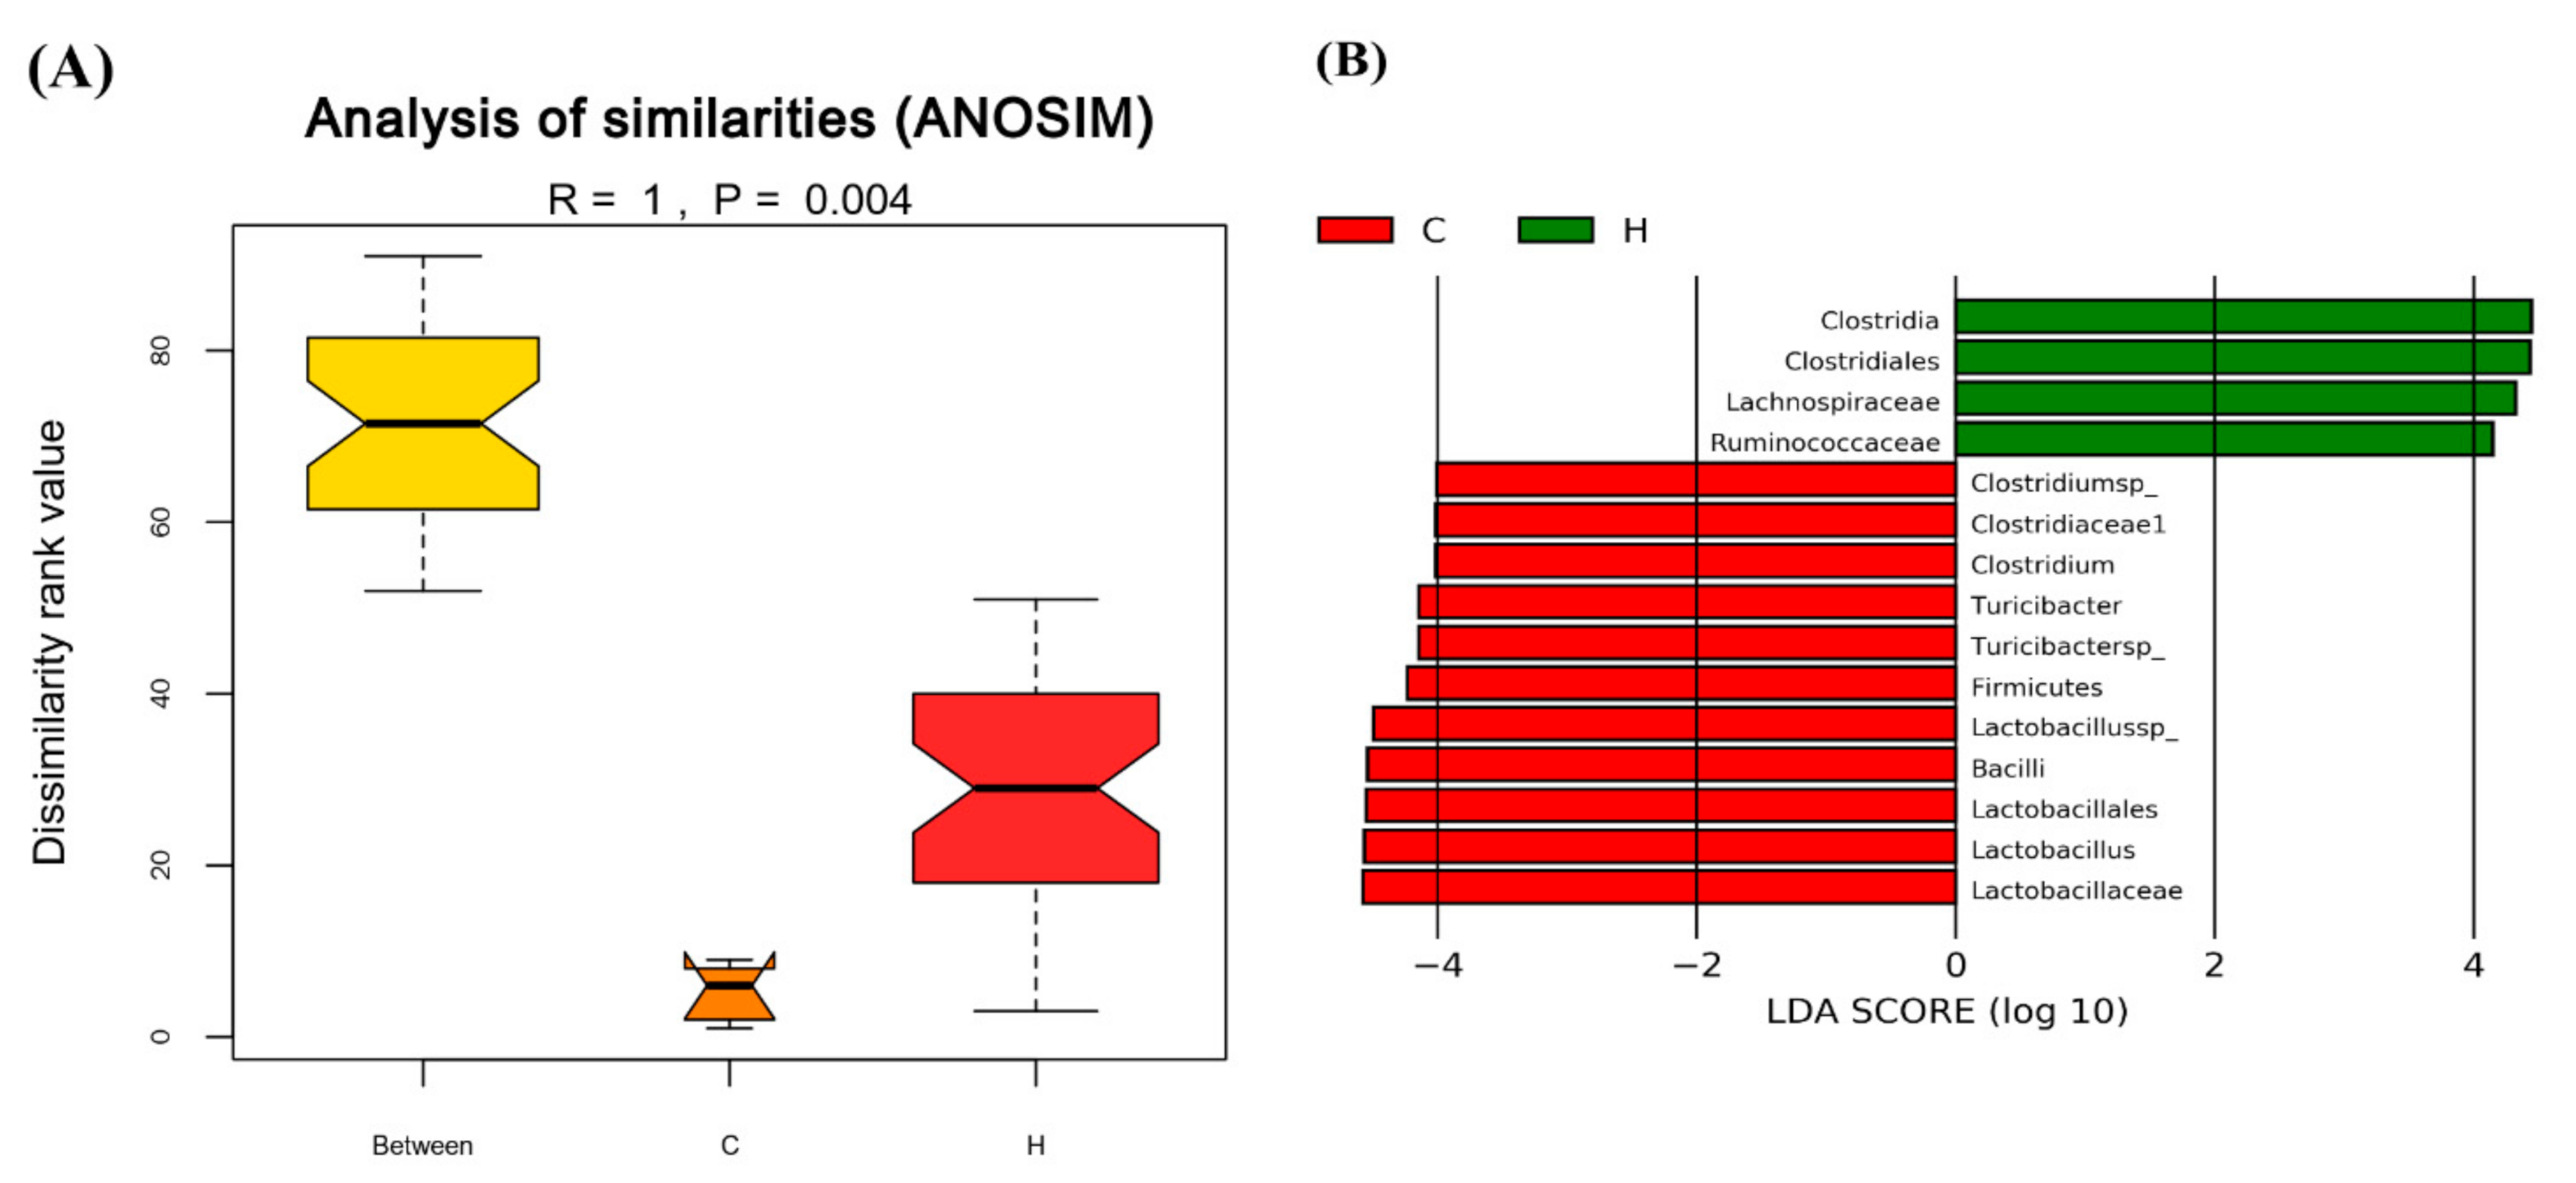
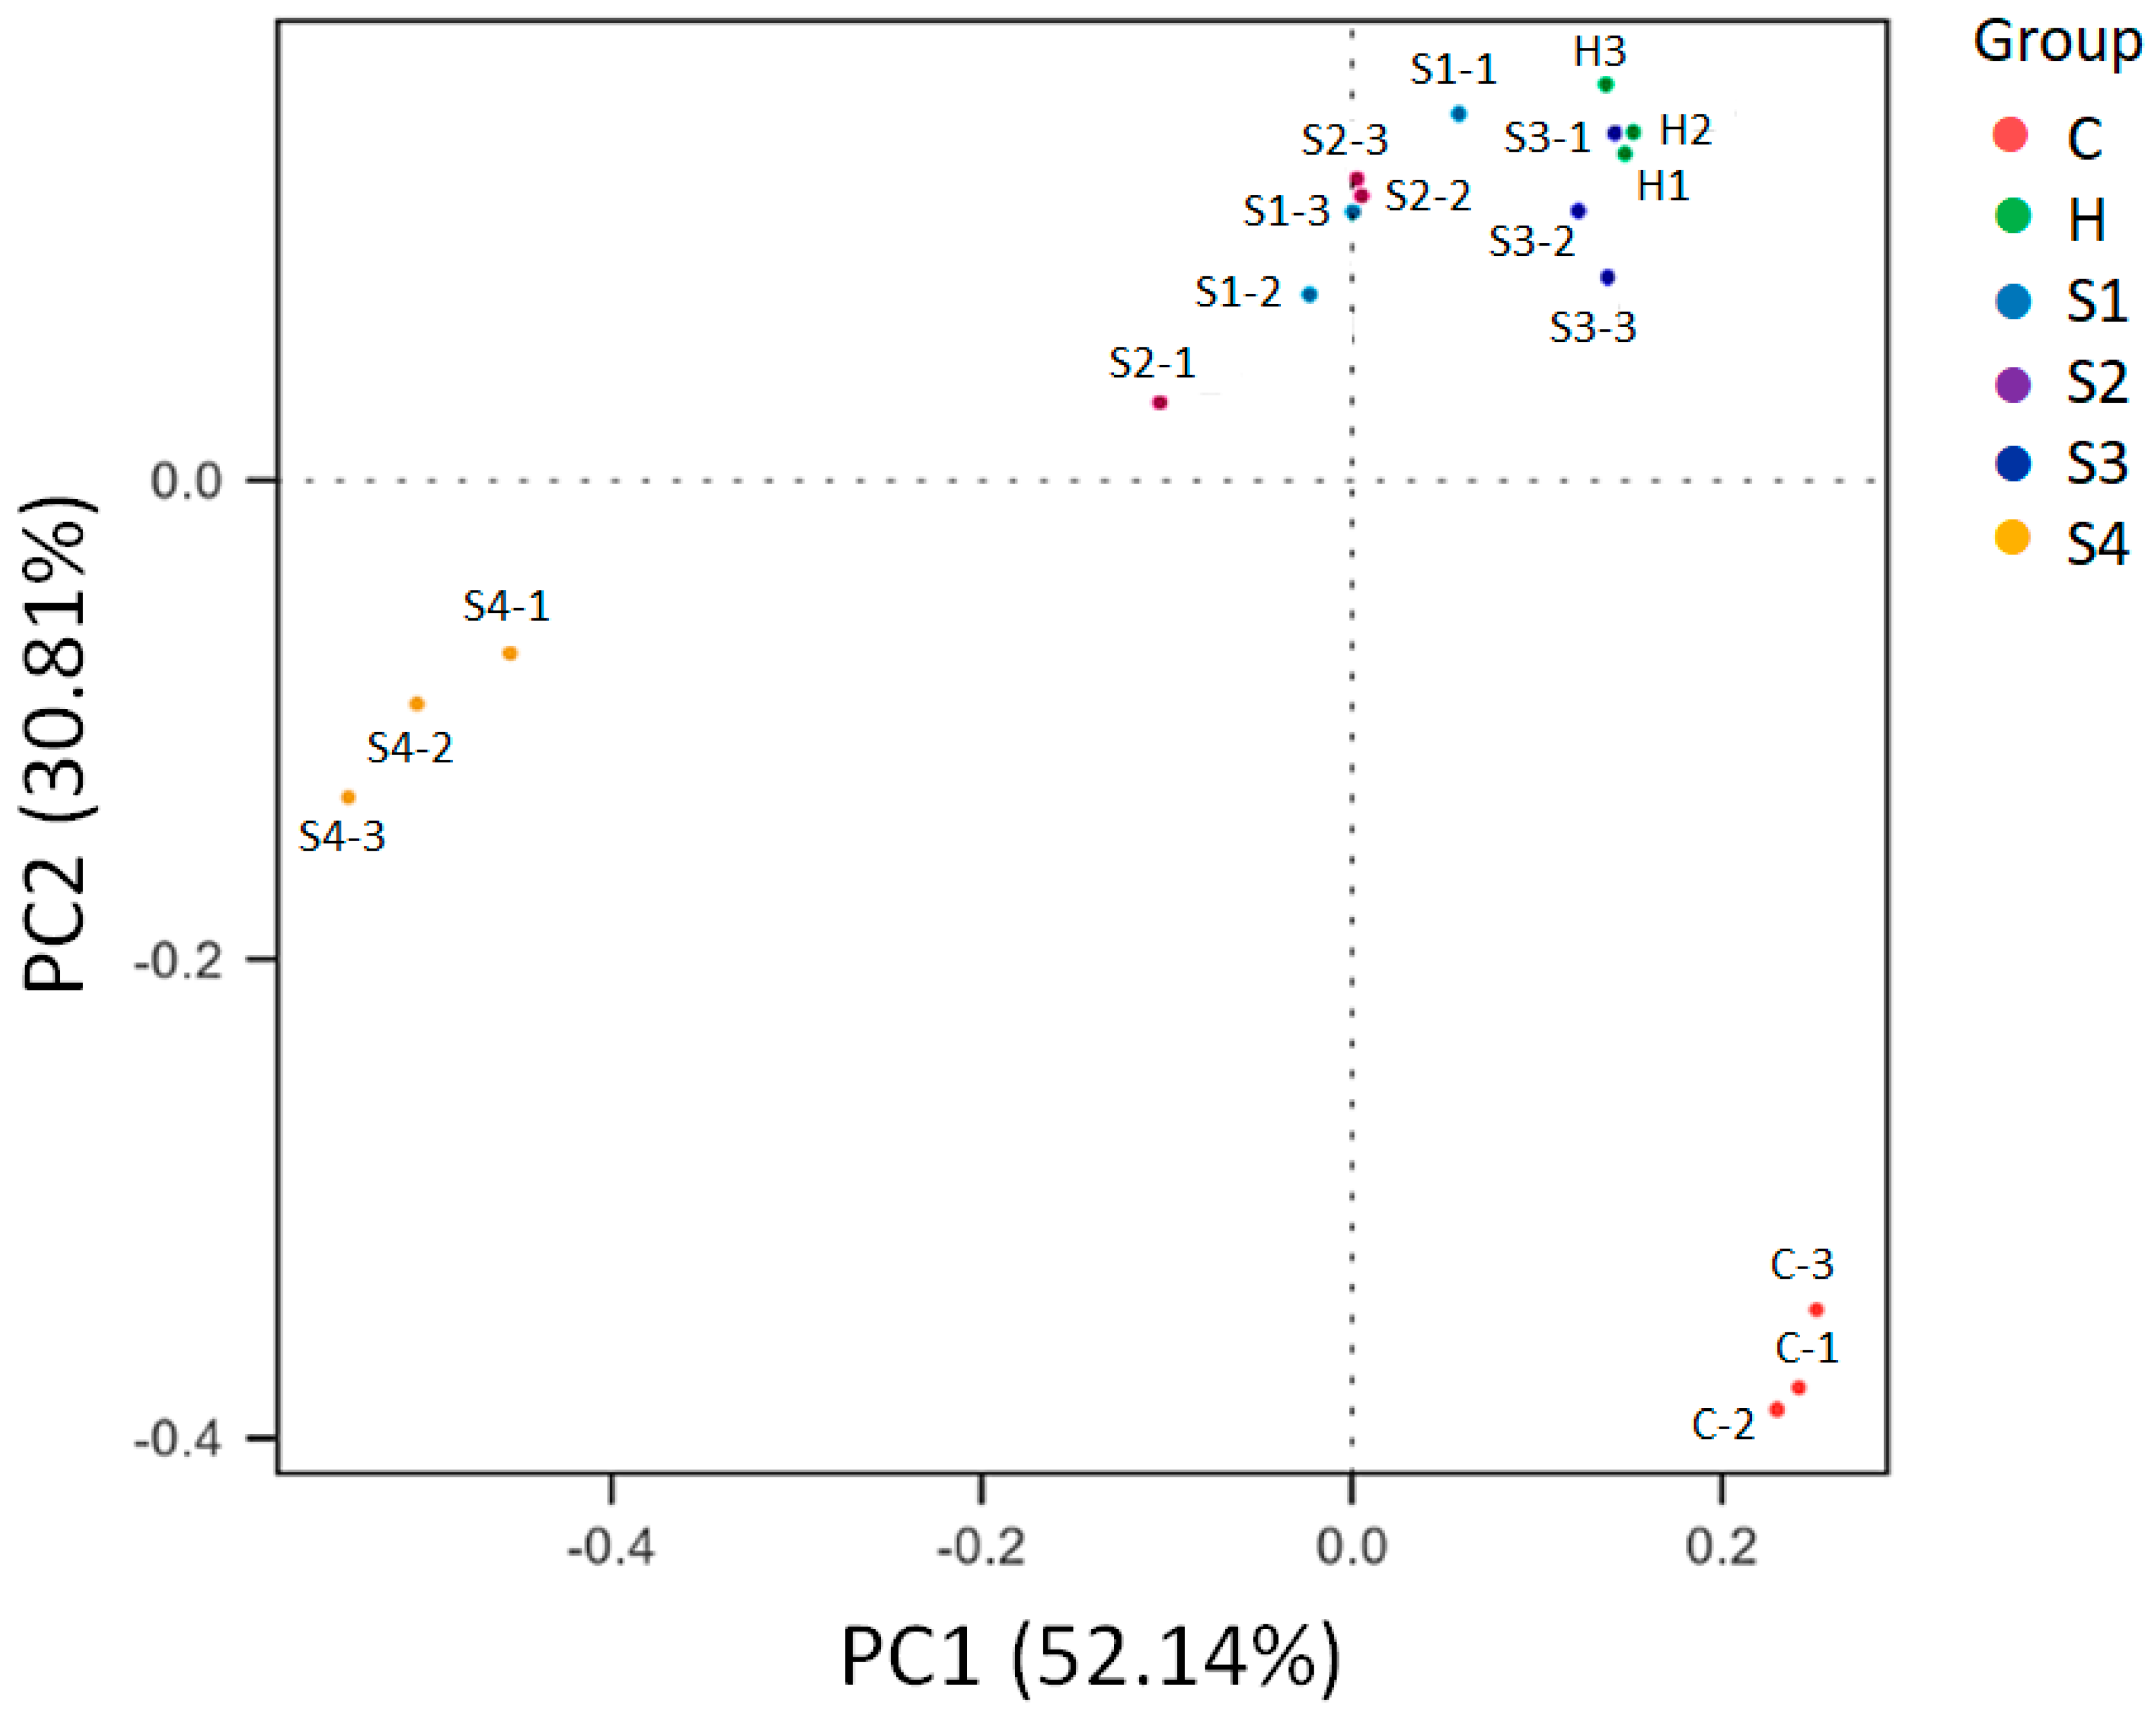
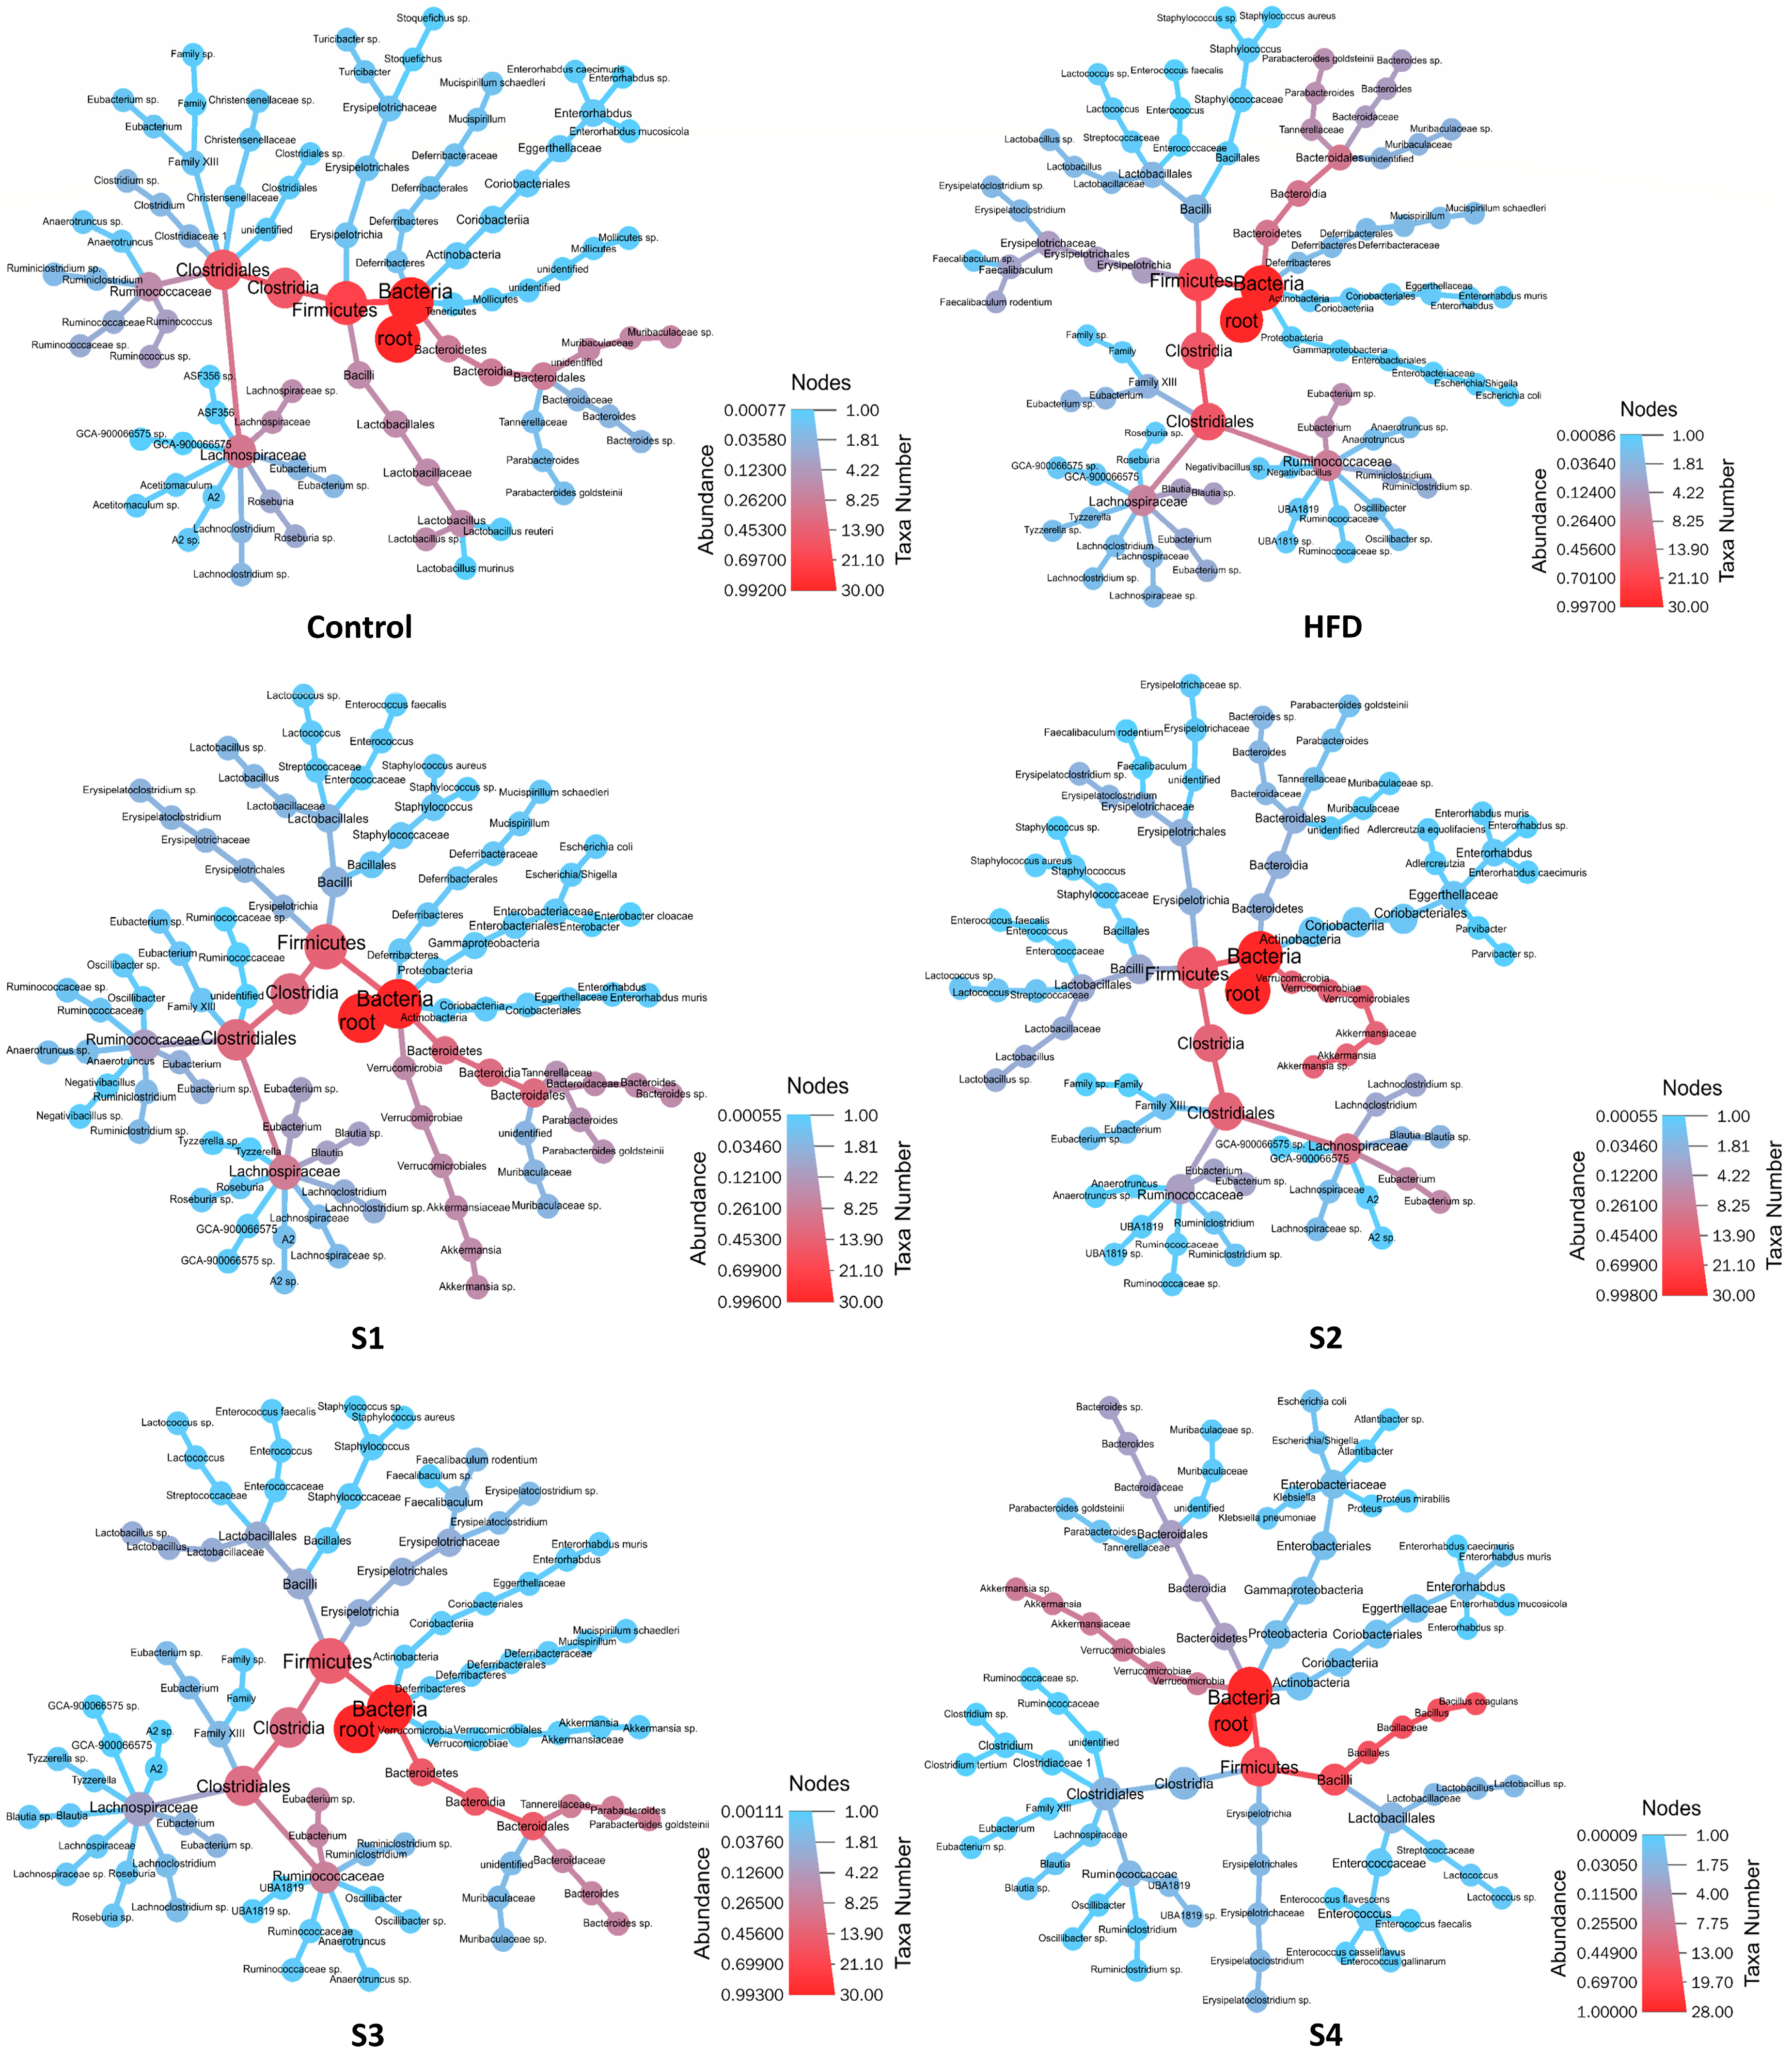
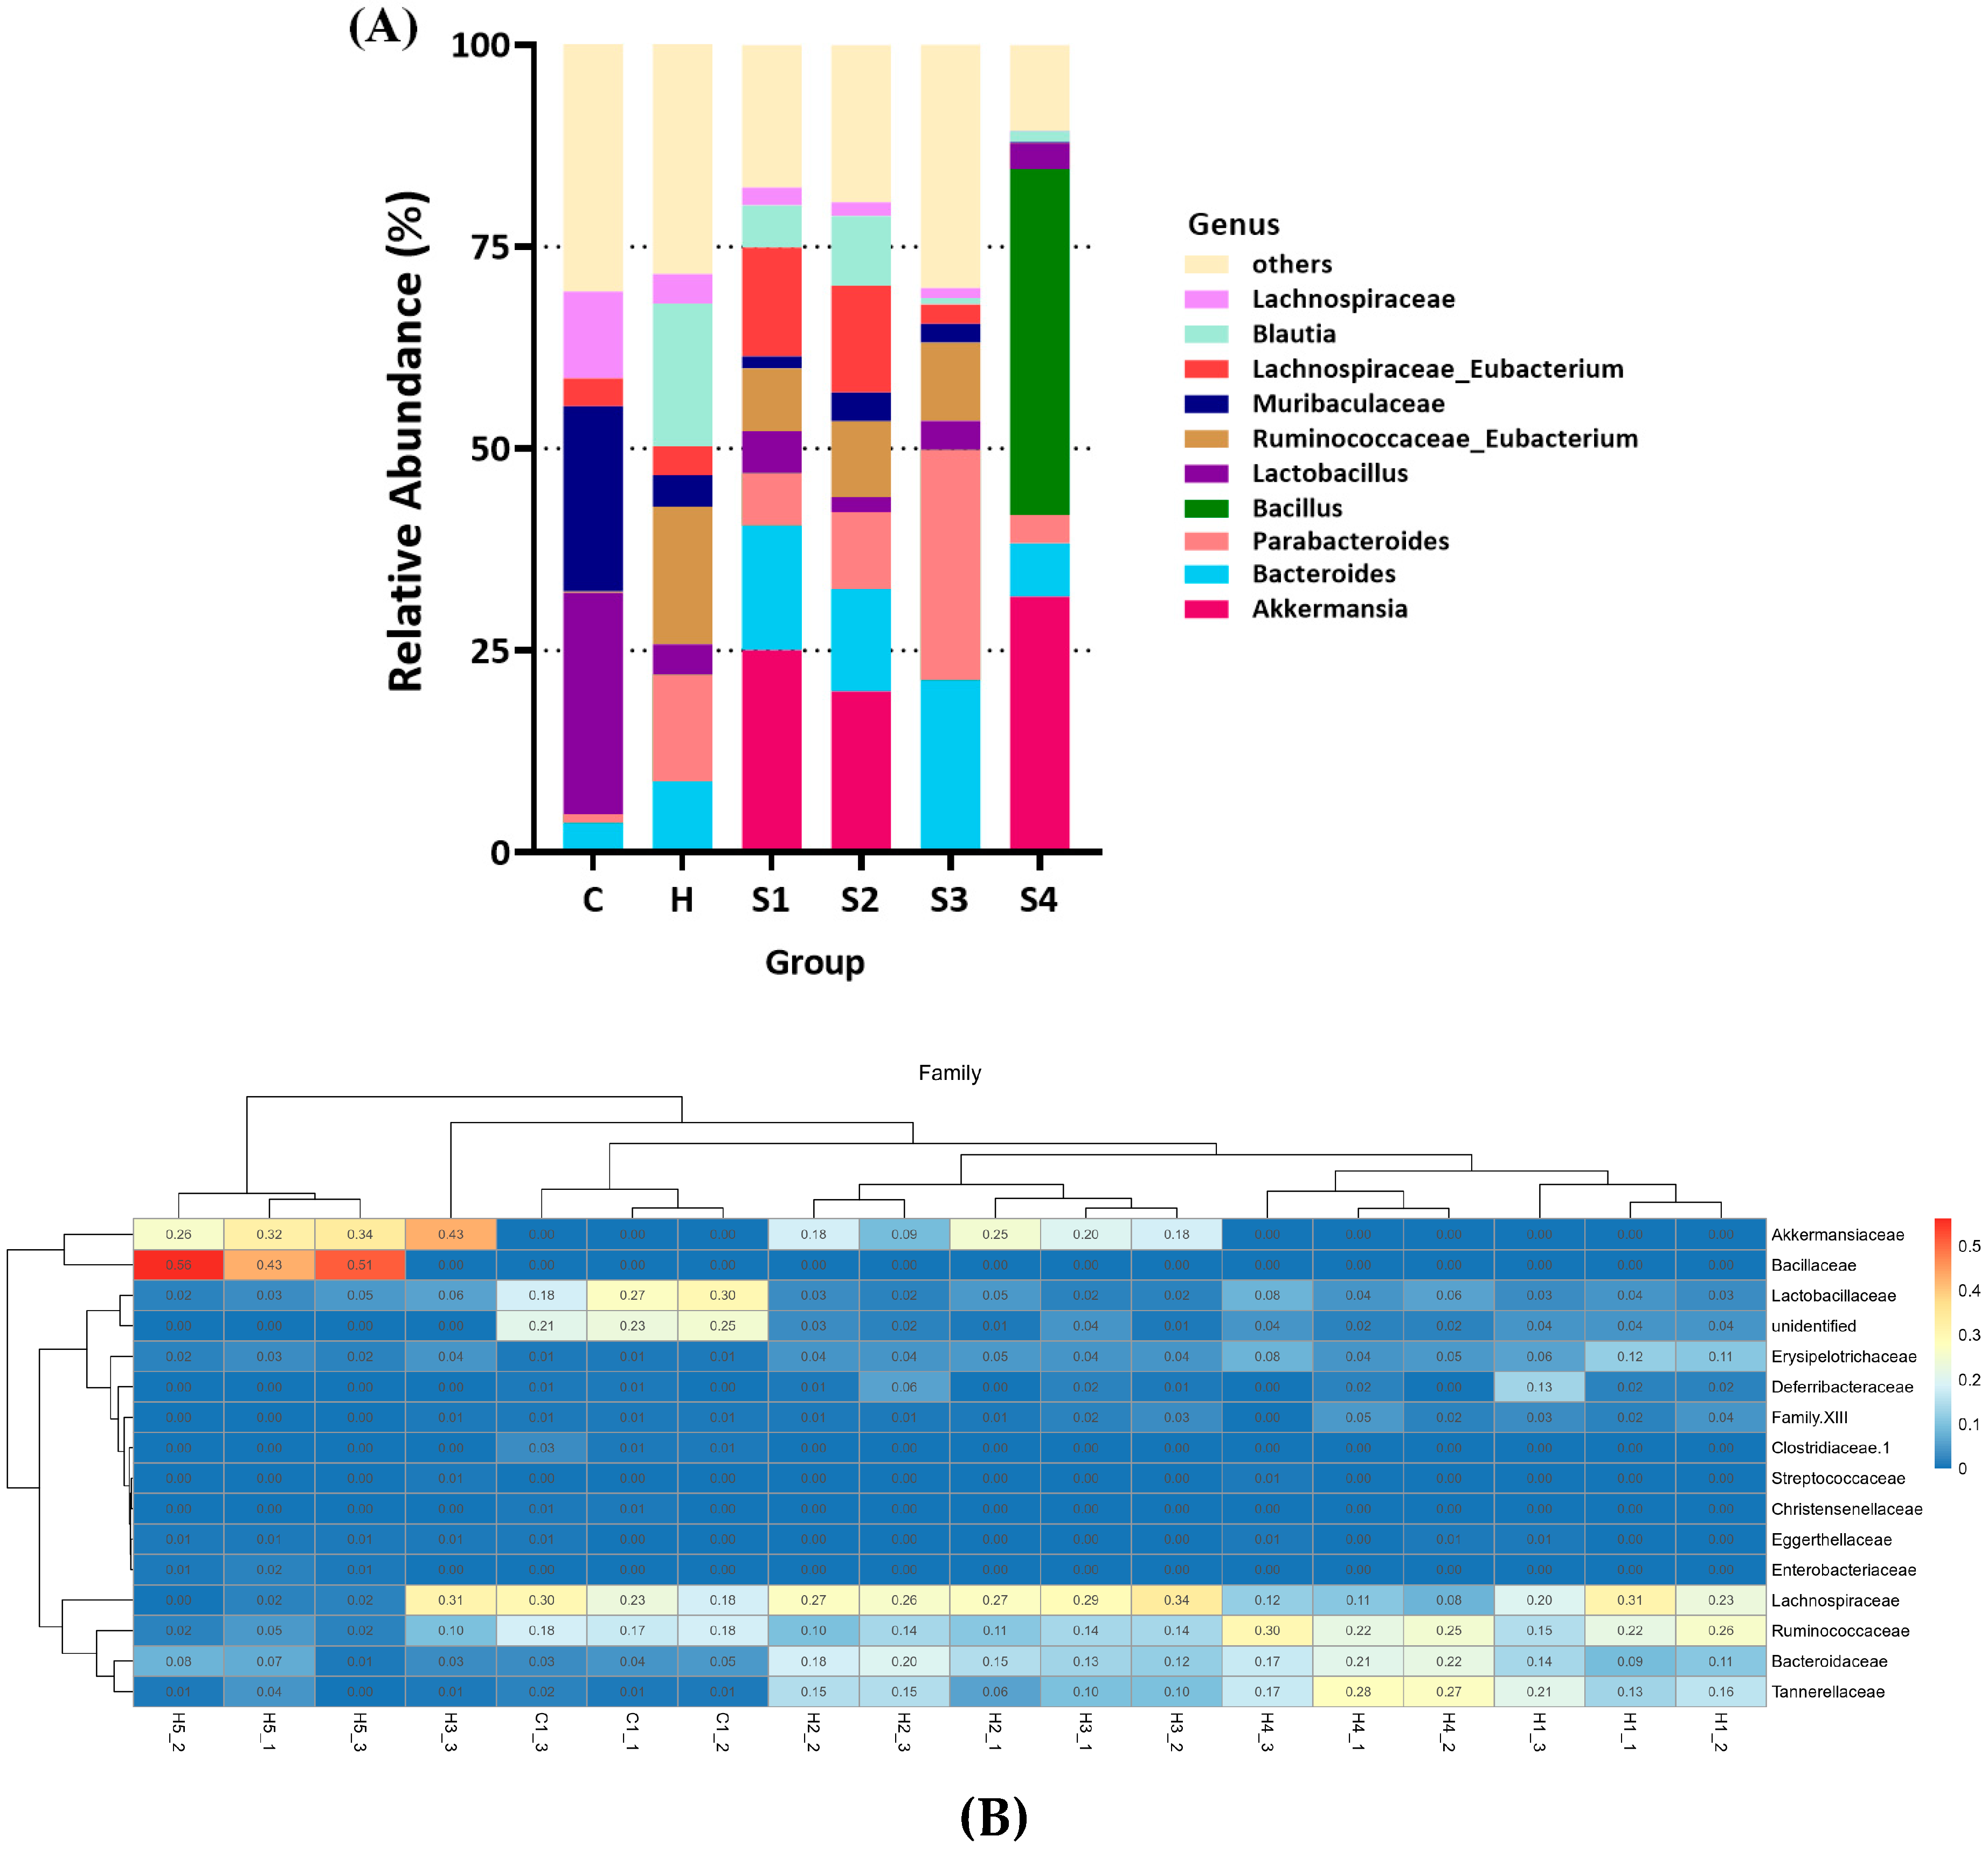
3.4. The Regulation of C. militaris on Gut Microbiota in HFSD-Induced Mice
4. Conclusions
Author Contributions
Funding
Institutional Review Board Statement
Informed Consent Statement
Conflicts of Interest
References
- Yoshikaw, N.; Nakamura, K.; Yamaguchi, Y.; Kagota, S.; Shinozuka, K.; Kunitomo, M. Antitumour activity of cordycepin in mice. Clin. Exp. Pharmacol. Physiol. 2004, 31, S51–S53. [Google Scholar] [CrossRef]
- Wehbe-Janek, H.; Shi, Q.; Kearney, C.M. Cordycepin/hydroxyurea synergy allows low dosage efficacy of cordycepin in MOLT-4 leukemia cells. Anticancer Res. 2007, 27, 3143–3146. [Google Scholar]
- Chen, Y.; Chen, Y.C.; Lin, Y.T.; Huang, S.H.; Wang, S.M. Cordycepin induces apoptosis of CGTH W-2 thyroid carcinoma cells through the calcium-calpain-caspase 7-PARP pathway. J. Agric. Food Chem. 2010, 58, 11645–11652. [Google Scholar] [CrossRef]
- Xu, H.L.; Zhang, L.J.; Shi, H.; Zhu, X.; He, X. Effects of cordycepin on Hep G2 and EA.hy926 cells: Potential antiproliferative, antimetastatic and anti-angiogenic effects on hepatocellular carcinoma. Oncol. Lett. 2014, 7, 1556–1562. [Google Scholar]
- Yamamoto, K.; Shichiri, H.; Uda, A.; Yamashita, K.; Nishioka, T.; Kume, M.; Makimoto, H.; NNakagawa, T.; Hirano, T.; Hirai, M. Apoptotic effects of the extracts of Cordyceps militaris via Erk phosphorylation in a renal cell carcinoma cells line. Phytother. Res. 2015, 29, 707–713. [Google Scholar] [CrossRef]
- Lin, L.T.; Lai, Y.J.; Wu, S.C.; Hsu, W.H.; Tai, C.J. Optimal conditions for cordycepin production in surface liquid-cultured Cordyceps militaris treated with porcine liver extracts for suppression of oral cancer. J. Food Drug Anal. 2018, 26, 135–144. [Google Scholar] [CrossRef] [PubMed] [Green Version]
- Sun, H.; Yu, X.; Li, T.; Zhu, Z. Structure and hypoglycemic activity of a novel exopolysaccharide of Cordyceps militaris. Int. J. Biol. Macromol. 2021, 166, 496–508. [Google Scholar] [CrossRef] [PubMed]
- Takakura, K.; Ito, S.; Sonoda, J.; Tabata, K.; Shiozaki, M.; Nagai, K.; Shibata, M.; Koike, M.; Uchiyama, Y.; Gotow, T. Cordyceps militaris improves the survival of Dahl salt-sensitive hypertensive rats possibly via influences of mitochondrial and autophagy functions. Heliyon 2017, 3, e00462. [Google Scholar] [CrossRef] [PubMed]
- Lee, M.R.; Kim, J.E.; Choi, J.Y.; Park, J.J.; Kim, H.R.; Song, B.R.; Choi, Y.W.; Kim, K.M.; Song, H.; Hwang, D.Y. Anti-obesity effect in high-fat-diet-induced obese C57NL/6 mice: Study of a novel extract from mulberry (Morus alba) leaves fermented with Cordyceps militaris. Exp. Ther. Med. 2019, 17, 2185–2193. [Google Scholar]
- Aziz, Q.; Dore, J.; Emmanuel, A.; Guarner, F.; Quigley, E.M.M. Gut microbiota and gastrointestinal health: Current concepts and future directions. Neurogastroenterol. Motil. 2013, 25, 4–15. [Google Scholar] [CrossRef]
- Venter, J.C.; Adams, M.D.; Myers, E.W.; Li, P.W.; Mural, R.J.; Sutton, G.G.; Smith, H.O.; Yandell, M.; Evans, C.A.; Holt, R.A.; et al. The sequence of the human genome. Science 2001, 291, 1304–1351. [Google Scholar] [CrossRef] [PubMed] [Green Version]
- Liu, S.; da Cunha, A.P.; Rezende, R.M.; Cialic, R.; Wei, Z.; Bry, L.; Comstock, L.E.; Gandhi, R.; Weiner, H.L. The host shapes the gut microbiota via fecal microRNA. Cell Host Microb. 2016, 19, 32–43. [Google Scholar] [CrossRef] [Green Version]
- Arumugam, M.; Raes, J.; Pelletier, E.; Le Paslier, D.; Yamada, T.; Mende, D.R.; Fernandes, G.R.; Tap, J.; Bruls, T.; Batto, J.-M.; et al. Enterotypes of the human gut microbiome. Nature 2011, 473, 174–180. [Google Scholar] [CrossRef] [PubMed]
- Wu, G.D.; Chen, J.; Hoffmann, C.; Bittinger, K.; Chen, Y.Y.; Keilbaugh, S.A.; Bewtra, M.; Knights, D.; Walters, W.A.; Knight, R.; et al. Linking long-term dietary patterns with gut microbial enterotypes. Science 2011, 334, 105–108. [Google Scholar] [CrossRef] [Green Version]
- Ma, H.; Zhang, B.; Hu, Y.; Wang, J.; Liu, J.; Qin, R.; Lv, S.; Wang, S. Correlation analysis of intestinal redox state with the gut microbiota reveals the positive intervention of tea polyphenols on hyperlipidemia in high fat diet fed mice. J. Agric. Food Chem. 2019, 67, 7325–7335. [Google Scholar] [CrossRef]
- Kong, C.; Gao, R.; Yan, X.; Huang, L.; Qin, H. Probiotics improve gut microbiota dysbiosis in obese mice fed a high-fat or high-sucrose diet. Nutrition 2019, 60, 175–184. [Google Scholar] [CrossRef] [PubMed]
- An, Y.; Li, Y.; Wang, X.; Chen, Z.; Xu, H.; Wu, L. Cordycepin reduces weight through regulating gut microbiota in high-fat diet-induced obese rats. Lipids Health Dis. 2018, 17, 276. [Google Scholar] [CrossRef] [Green Version]
- Chen, L.; Zhang, L.; Wang, W.; Qiu, W.; Liu, L.; Ning, A.; Cao, J.; Huang, M.; Zhong, M. Polysaccharides isolated from Cordyceps sinensis contribute to the progression of NASH by modifying the gut microbiota in mice fed a high-fat diet. PLoS ONE 2020, 15, e0232972. [Google Scholar] [CrossRef] [PubMed]
- Chen, S.; Wang, J.; Fang, Q.; Dong, N.; Nie, S. Polysaccharide from natural Cordyceps sinensis ameliorated intestinal injury and enhanced antioxidant activity in immunosuppressed mice. Food Hydrocoll. 2019, 89, 661–667. [Google Scholar] [CrossRef]
- Wang, J.; Nie, S.; Cui, S.W.; Wang, Z.; Phillips, A.O.; Phillips, G.O.; Li, Y.; Xie, M. Structural characterization and immunostimulatory activity of a glucan from natural Cordyceps sinensis. Food Hydrocoll. 2017, 67, 139–147. [Google Scholar] [CrossRef]
- Wang, J.; Nie, S.; Chen, S.; Phillips, A.O.; Phillips, G.O.; Li, Y.; Xie, M.; Cui, S.W. Structural characterization of an α-1,6-linked galactomannan from natural Cordyceps sinensis. Food Hydrocoll. 2018, 78, 77–91. [Google Scholar] [CrossRef]
- Kong, X.R.; Zhu, Z.Y.; Zhang, X.J.; Zhu, Y.M. Effects of Cordyceps polysaccharides on pasting properties and in vitro starch digestibility of wheat starch. Food Hydrocoll. 2020, 102, 105604. [Google Scholar] [CrossRef]
- Chang, C.Y.; Lue, M.Y.; Pan, T.M. Determination of adenosine, cordycepin and ergosterol contents in cultivated Antrodia camphorate by HPLC methods. J. Food Drug Anal. 2005, 13, 338–342. [Google Scholar]
- Urtasun, R.; Diaz-Gomez, J.; Arana, M.; Pajares, M.J.; Oneca, M.; Torre, P.; Jimenez, M.; Munilla, G.; Varajas, M.; Encio, I. A combination of apple vinegar drink with Bacillus coagulans ameliorates high fat diet-induced body weight gain, insulin resistance and hepatic steatosis. Nutrients 2020, 12, 2504. [Google Scholar] [CrossRef]
- Liu, P.; Xie, J.; Liu, J.; Ouyang, J. A novel thermostable β-galactosidase from Bacillus coagulans with excellent hydrolysis ability for lactose in whey. J. Dairy Sci. 2019, 102, 9740–9748. [Google Scholar] [CrossRef]
- Jia, J.; Zhang, X.; Hu, Y.S.; Wu, Y.; Wang, Q.Z.; Li, N.N.; Guo, Q.C.; Dong, X.C. Evaluation of in vivo antioxidant activities of Ganoderma lucidum polysaccharides in STZ-diabetic rats. Food Chem. 2009, 115, 32–36. [Google Scholar] [CrossRef]
- Dall’Agnol, R.; Von Poser, G.L. The use of complex polysaccharides in the management of metabolic diseases: The case of Solanum lycocarpum fruits. J. Ethnopharmacol. 2000, 71, 337–341. [Google Scholar] [CrossRef]
- Lee, B.H.; Hsu, W.H.; Pan, T.M. Inhibitory effects of dioscorea polysaccharide on TNF-α-induced insulin resistance in mouse FL83B cells. J. Agric. Food Chem. 2011, 59, 5279–5285. [Google Scholar] [CrossRef]
- Li, M.M. Protective effect of Lycium barbarum polysaccharides on streptozotocin-induced oxidative stress in rats. Int. J. Biol. Macromol. 2007, 40, 461–465. [Google Scholar] [CrossRef]
- Nava, G.M.; Friedrichsen, H.J.; Stappenbeck, T.S. Spatial organization of intestinal microbiota in the mouse ascending colon. ISME J. 2011, 5, 627–638. [Google Scholar] [CrossRef] [Green Version]
- Skoog, E.C.; Lindberg, M.; Linden, S.K. Strain-dependent proliferation in response to human gastric mucin and adhesion properties of Helicobacter pylori are not affected by co-isolated Lactobacillus sp. Helicobacter 2011, 16, 9–19. [Google Scholar] [CrossRef]
- Bai, Z.; Zhang, Z.; Ye, Y.; Wang, S. Sodium butyrate induces differentiation of gastric cancer cells to intestinal cells via the PTEN/phosphoinositide 3-kinase pathway. Cell Biol. Int. 2010, 34, 1141–1145. [Google Scholar] [CrossRef]
- Crost, E.H.; Tailford, L.E.; Monestier, M.; Swarbreck, D.; Henrissat, B.; Crossman, L.C.; Juge, N. The mucin-degradation strategy of Ruminococcus gnavus: The importance of intramolecular trans-sialidases. Gut Microbes 2016, 7, 302–312. [Google Scholar] [CrossRef] [Green Version]
- Derrien, M.; Vaughan, E.E.; Plugge, C.M.; de Vos, W.M. Akkermansia muciniphila gen. nov., sp. nov., a human intestinal mucin-degrading bacterium. Int. J. Syst. Evolut. Microbiol. 2004, 54, 1469–1476. [Google Scholar] [CrossRef] [PubMed] [Green Version]
- Xu, J.; Bjursell, M.K.; Himrod, J.; Deng, S.; Carmichael, L.K.; Chiang, H.C.; Hooper, L.V.; Gordon, J.I. A genomic view of the human-Bacteroides thetaiotaomicron symbiosis. Science 2003, 299, 2074–2076. [Google Scholar] [CrossRef] [PubMed] [Green Version]
- He, F.; Ouwehan, A.C.; Hashimoto, H.; Isolauri, E.; Benno, Y.; Salminen, S. Adhesion of Bifidobacterium spp. to human intestinal mucus. Microbiol. Immunol. 2001, 45, 259–262. [Google Scholar] [CrossRef] [PubMed]
- Macfarlane, G.T.; Gibson, G.R. Formation of glycoprotein degrading enzymes by Bacteroides fragilis. FEMS Microbiol. Lett. 1991, 61, 289–293. [Google Scholar] [CrossRef]
- Png, C.W.; Linden, S.K.; Gilshenan, K.S.; Zoetendal, E.G.; McSweeney, C.S.; Sly, L.I. Mucolytic bacteria with increased prevalence in IBD mucosa augment in vitro utilization of mucin by other bacteria. Am. J. Gastroenterol. 2010, 105, 2420–2428. [Google Scholar] [CrossRef]
- Berry, D.; Stecher, B.; Schintlmeister, A.; Reichert, J.; Brugiroux, S.; Wild, B. Host-compound foraging by intestinal microbiota revealed by single-cell stable isotope probing. Proc. Natl. Acad. Sci. USA 2013, 110, 4720–4725. [Google Scholar] [CrossRef] [Green Version]
- Van den Abbeele, P.; Belzer, C.; Goossens, M.; Kleerebezem, M.; De Vos, W.M.; Thas, O. Butyrate-producing Clostridium cluster XIVa species specifically colonize mucins in an in vitro gut model. ISME J. 2013, 7, 949–961. [Google Scholar] [CrossRef] [Green Version]
- Ashida, H.; Maki, R.; Ozawa, H.; Tani, Y.; Kiyohara, M.; Fujita, M. Characterization of two different endo-alpha-N-acetylgalactosaminidases from probiotic and pathogenic enterobacteria, Bifidobacterium longum and Clostridium perfringens. Glycobiology 2008, 18, 727–734. [Google Scholar] [CrossRef] [PubMed] [Green Version]
- Ng, K.M.; Ferreyra, J.A.; Higginbottom, S.K.; Lynch, J.B.; Kashyap, P.C.; Gopinath, S. Microbiota-liberated host sugars facilitate post-antibiotic expansion of enteric pathogens. Nature 2013, 502, 96–99. [Google Scholar] [CrossRef] [Green Version]
- Etzold, S.; Kober, O.I.; MacKenzie, D.A.; Tailford, L.E.; Gunning, A.P.; Walshaw, J. Structural basis for adaptation of lactobacilli to gastrointestinal mucus. Environ. Microbiol. 2014, 16, 888–903. [Google Scholar] [CrossRef] [PubMed]
- Sicard, J.F.; Le Bihan, G.; Vogeleer, P.; Jacques, M.; Harel, J. Interactions of intestinal bacteria with components of the intestinal mucus. Front. Cell. Infect. Microbiol. 2017, 7, 387. [Google Scholar] [CrossRef]
- Clarke, K.R. Non-parametric multivariate analysis of changes in community structure. Aust. J. Ecol. 1993, 18, 117–143. [Google Scholar] [CrossRef]
- Segata, N.; Izard, J.; Waldron, L.; Gevers, D.; Miropolsky, L.; Garrett, W.S.; Huttenhower, C. Metagenomic biomarker discovery and explanation. Genome Biol. 2011, 12, R60. [Google Scholar] [CrossRef] [Green Version]
- Cani, P.D.; de Vos, W.M. Next-generation beneficial microbes: The case of Akkermansia muciniphila. Front. Microbiol. 2017, 8, 1765. [Google Scholar] [CrossRef] [PubMed]
- Thomas, L.V.; Suzuki, K.; Zhao, J. Probiotics: A proactive approach to health. A symposium report. Br. J. Nutr. 2015, 114, S1–S15. [Google Scholar] [CrossRef] [Green Version]
- Shih, C.T.; Yeh, Y.T.; Lin, C.C.; Yang, L.Y.; Chiang, C.P. Akkermansia muciniphila is negatively correlated with hemoglobin A1c in refractory diabetes. Microorganisms 2020, 8, 1360. [Google Scholar] [CrossRef]
- Dao, M.C.; Everard, A.; Aron-Wisnewsky, J.; Sokolovska, N.; Prifti, E.; Verger, E.O.; Kayser, B.D.; Levenez, F.; Chilloux, J.; Hoyles, L.; et al. Akkermansia muciniphila and improved metabolic health during a dietary intervention in obesity: Relationship with gut microbiome richness and ecology. Gut 2016, 65, 426–436. [Google Scholar] [CrossRef] [Green Version]
- Lee, B.H.; Lo, Y.H.; Pan, T.M. Anti-obesity activity of Lactobacillus fermented soy milk products. J. Funct. Foods 2013, 5, 905–913. [Google Scholar] [CrossRef]
- Lippert, K.; Kedenko, L.; Antonielli, L.; Kedenko, I.; Gemeier, C.; Leitner, M.; Kautzky-Willer, A.; Paulweber, B.; Hacki, E. Gut microbiota dysbiosis associated with glucose metabolism disorders and the metabolic syndrome in older adults. Benef. Microbes 2017, 8, 545–556. [Google Scholar] [CrossRef] [PubMed]
- Kasahara, K.; Krautkramer, K.A.; Org, E.; Romano, K.A.; Kerby, R.L.; Vivas, E.I.; Mehrabian, M.; Denu, J.M.; Backhed, F.; Lusis, A.; et al. Interactions between Roseburia intestinalis and diet modulate atherogenesis in a murine model. Nat. Microbiol. 2018, 3, 1461. [Google Scholar] [CrossRef] [PubMed]
- Chen, W.; Liu, F.; Ling, Z.; Tong, X.; Xiang, C. Human intestinal lumen and mucosa-associated microbiota in patients with colorectal cancer. PLoS ONE 2012, 7, e39743. [Google Scholar] [CrossRef] [PubMed]
- Bajaj, J.S.; Hylemon, P.B.; Ridlon, J.M.; Heuman, D.M.; Daita, K.; White, M.B.; Monteith, P.; Noble, N.A.; Sikaroodi, M.S.; Gillevet, P.M. Colonic mucosal microbiome differs from stool microbiome in cirrhosis and hepatic encephalopathy and is linked to cognition and inflammation. Am. J. Physiol. Gastrointest. Liver Physiol. 2012, 303, G675–G685. [Google Scholar] [CrossRef]
- Schirmer, M.; Smeekens, S.P.; Vlamakis, H.; Jaeger, M.; Oosting, M.; Franzosa, E.A.; Horst, R.T.; Jansen, T.; Jacobs, L.; Bonder, M.J.; et al. Linking the human gut microbiome to inflammatory cytokine production capacity. Cell 2016, 167, 1897. [Google Scholar] [CrossRef] [Green Version]
- Shen, F.; Zheng, R.D.; Sun, X.Q.; Ding, W.J.; Wang, X.Y.; Fan, J.G. Gut microbiota dysbiosis in patients with non-alcoholic fatty liver disease. Hepat. Pancreat. Dis. Int. 2017, 16, 375–381. [Google Scholar] [CrossRef]


Publisher’s Note: MDPI stays neutral with regard to jurisdictional claims in published maps and institutional affiliations. |
© 2021 by the authors. Licensee MDPI, Basel, Switzerland. This article is an open access article distributed under the terms and conditions of the Creative Commons Attribution (CC BY) license (https://creativecommons.org/licenses/by/4.0/).
Share and Cite
Lee, B.-H.; Chen, C.-H.; Hsu, Y.-Y.; Chuang, P.-T.; Shih, M.-K.; Hsu, W.-H. Polysaccharides Obtained from Cordyceps militaris Alleviate Hyperglycemia by Regulating Gut Microbiota in Mice Fed a High-Fat/Sucrose Diet. Foods 2021, 10, 1870. https://doi.org/10.3390/foods10081870
Lee B-H, Chen C-H, Hsu Y-Y, Chuang P-T, Shih M-K, Hsu W-H. Polysaccharides Obtained from Cordyceps militaris Alleviate Hyperglycemia by Regulating Gut Microbiota in Mice Fed a High-Fat/Sucrose Diet. Foods. 2021; 10(8):1870. https://doi.org/10.3390/foods10081870
Chicago/Turabian StyleLee, Bao-Hong, Chia-Hsiu Chen, Yi-Yun Hsu, Pei-Ting Chuang, Ming-Kuei Shih, and Wei-Hsuan Hsu. 2021. "Polysaccharides Obtained from Cordyceps militaris Alleviate Hyperglycemia by Regulating Gut Microbiota in Mice Fed a High-Fat/Sucrose Diet" Foods 10, no. 8: 1870. https://doi.org/10.3390/foods10081870